Chart of the week

Market momentum fades as the economic cycle ages

Stock and bond returns in 2017 and 2018

June 22, 2018 | 1 minute read
Stock and bond returns in 2017 and 2018
  • Markets sidestepped a range of concerns last year as investors focused on the benefits of synchronized global growth over thorny issues that could have dampened investor sentiment. These included persistent tensions with North Korea, falling oil prices early in the year and the end of the Fed’s quantitative easing policy.
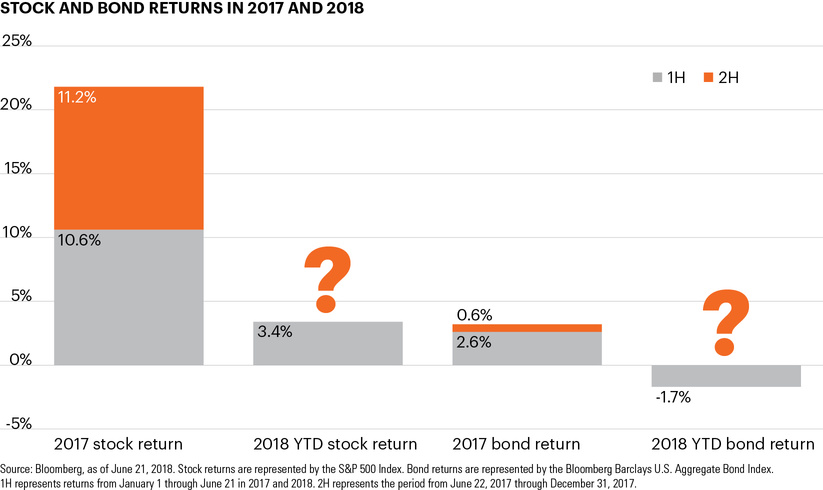
  • 2018 has proven to be a different environment for investors. This week’s chart shows stark differences in performance for U.S. equity and fixed income markets in 2017 and 2018. Equity markets rose steadily through the first half of 2017 and ended the year by posting gains of over 20%. Returns for traditional fixed income investors, while muted, were still positive.1
  • This year, however, equity and fixed income returns are tracking far below those of last year. Bond returns have turned negative while U.S. equity markets have largely remained flat since January 2018.1
  • As we first wrote nearly a year ago, we continue to believe a traditional 60/40 portfolio faces significant headwinds in the coming years due to changing market conditions. Looking forward, investors may increasingly need to find alternative sources of income and growth to help achieve their financial goals.

  • Bloomberg. Equity returns are represented by the S&P 500 Index as of June 21, 2018. Fixed income returns are represented by the Bloomberg Barclays U.S. Aggregate Bond Index as of June 21, 2018.

The chart of the week and any accompanying data is for informational purposes only and shall not be considered an investment recommendation or promotion of FS Investments or any FS Investments fund. The chart of the week is subject to change at any time based on market or other conditions, and FS Investments and FS Investment Solutions, LLC disclaim any responsibility to update such market commentary. The chart of the week should not be relied on as investment advice, and because investment decisions for the FS Investments funds are based on numerous factors, may not be relied on as an indication of the investment intent of any FS Investments fund. None of FS Investments, its funds, FS Investment Solutions, LLC or their respective affiliates can be held responsible for any direct or incidental loss incurred as a result of any reliance on the chart of the week or other opinions expressed therein. Any discussion of past performance should not be used as an indicator of future results.

This information is educational in nature and does not constitute a financial promotion, investment advice or an inducement or incitement to participate in any product, offering or investment. FS Investments is not adopting, making a recommendation for or endorsing any investment strategy or particular security. All views, opinions and positions expressed herein are that of the author and do not necessarily reflect the views, opinions or positions of FS Investments. All opinions are subject to change without notice, and you should always obtain current information and perform due diligence before participating in any investment. FS Investments does not provide legal or tax advice and the information herein should not be considered legal or tax advice. Tax laws and regulations are complex and subject to change, which can materially impact any investment result. FS Investments cannot guarantee that the information herein is accurate, complete, or timely. FS Investments makes no warranties with regard to such information or results obtained by its use, and disclaims any liability arising out of your use of, or any tax position taken in reliance on, such information.

Any projections, forecasts and estimates contained herein are based upon certain assumptions that the author considers reasonable. Projections are necessarily speculative in nature, and it can be expected that some or all of the assumptions underlying the projections will not materialize or will vary significantly from actual results. The inclusion of projections herein should not be regarded as a representation or guarantee regarding the reliability, accuracy or completeness of the information contained herein, and neither FS Investments nor the author are under any obligation to update or keep current such information.

All investing is subject to risk, including the possible loss of the money you invest.

Search our site