Chart of the week

Rising rates put the “40” to the test

As rates move higher, we look at fixed income performance amid rising rate environments, highlighting sub-investment grade’s strong relative returns.

November 13, 2020 | 2 minute read

Fixed income returns amid rising rate environments

Source: Data as of November 12, 2020. Barclays Agg refers to the Bloomberg Barclays U.S. Aggregate Bond Index. High yield bonds represented by ICE BofAML U.S. High Yield Index. Senior secured loans represented by S&P/LSTA Leveraged Loan Index.

  • Monday’s news of potentially significant developments in the race for a COVID-19 vaccine quickly adjusted the market’s dynamics. U.S. stocks resumed their post-election bounce and the 10-year U.S. Treasury yield jumped, nearly breaching the 1% mark.1
  • The 10-year yield of course remains very low on a historical basis, but it bears watching as it has been inching toward doubling its historical low of approximately 0.51% seen in early August.1 The increasing potential for a COVID-19 vaccine also could propel Treasury yields higher on a more sustained basis.
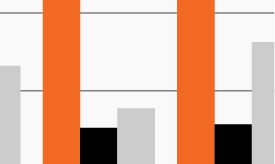
  • Against this backdrop, the chart looks at fixed income returns during periods of rising interest rates. Each period since 1994 saw relatively modest increases as they occurred within a broader, 40-year secular decline in interest rates. Yet traditional bonds fared poorly in each case, turning in negative returns in five out of the six instances shown.2
  • Meanwhile, high yield bonds and senior secured loans, which are generally more reactive to company-specific fundamentals and macroeconomic conditions than interest rates, performed notably better during historical periods of rising rates.
  • In an environment like today’s, high yield bonds or senior secured loans may be particularly attractive to investors looking to reduce or diversify their interest rate risk.

  • Federal Reserve Bank of St. Louis, http://bit.ly/2J3ufoX. As of November 12, 2020

  • Bloomberg Barclays U.S. Aggregate Bond Index, ICE BofAML U.S. High Yield Index, S&P/LSTA Leveraged Loan Index.

The chart of the week and any accompanying data is for informational purposes only and shall not be considered an investment recommendation or promotion of FS Investments or any FS Investments fund. The chart of the week is subject to change at any time based on market or other conditions, and FS Investments and FS Investment Solutions, LLC disclaim any responsibility to update such market commentary. The chart of the week should not be relied on as investment advice, and because investment decisions for the FS Investments funds are based on numerous factors, may not be relied on as an indication of the investment intent of any FS Investments fund. None of FS Investments, its funds, FS Investment Solutions, LLC or their respective affiliates can be held responsible for any direct or incidental loss incurred as a result of any reliance on the chart of the week or other opinions expressed therein. Any discussion of past performance should not be used as an indicator of future results.

This information is educational in nature and does not constitute a financial promotion, investment advice or an inducement or incitement to participate in any product, offering or investment. FS Investments is not adopting, making a recommendation for or endorsing any investment strategy or particular security. All views, opinions and positions expressed herein are that of the author and do not necessarily reflect the views, opinions or positions of FS Investments. All opinions are subject to change without notice, and you should always obtain current information and perform due diligence before participating in any investment. FS Investments does not provide legal or tax advice and the information herein should not be considered legal or tax advice. Tax laws and regulations are complex and subject to change, which can materially impact any investment result. FS Investments cannot guarantee that the information herein is accurate, complete, or timely. FS Investments makes no warranties with regard to such information or results obtained by its use, and disclaims any liability arising out of your use of, or any tax position taken in reliance on, such information.

Any projections, forecasts and estimates contained herein are based upon certain assumptions that the author considers reasonable. Projections are necessarily speculative in nature, and it can be expected that some or all of the assumptions underlying the projections will not materialize or will vary significantly from actual results. The inclusion of projections herein should not be regarded as a representation or guarantee regarding the reliability, accuracy or completeness of the information contained herein, and neither FS Investments nor the author are under any obligation to update or keep current such information.

All investing is subject to risk, including the possible loss of the money you invest.

Search our site