Chart of the week

A sharp rotation toward value as rates rise

Value dominates early 2022 as rates rise. Our chart looks at value’s relative outperformance and why flexibility may be key this year.

January 14, 2022 | 2 minute read

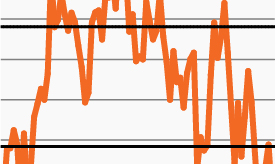
Weekly relative U.S. equity returns, value-growth

Source: Bloomberg Finance, L.P., as of January 12, 2022. Returns based on the S&P 500 Pure Value Index and S&P 500 Pure Growth Index.

  • After a narrow group of U.S. large cap growth stocks led the broader equity markets higher through the second half of 2021, markets appear to be rapidly internalizing the combination of strong growth and tighter financial conditions.
  • As this week’s chart highlights, 2022 has ushered in a violent rotation in equity market leadership with high-multiple growth stocks falling sharply and cyclicals enjoying a healthy start to the New Year. Value stocks have outperformed growth stocks by approximately 10% year-to-date driven largely by energy and financials.1
  • The Nasdaq 100 plunged 4.46% in the first week of January, its worst week since February 2021, highlighting the significant downward pressure on mega cap tech stocks. The selling pressures continued this week with the index down -0.62% through Thursday.
  • Given the backdrop of rising inflation, evolving central bank policy and the prospect for generally strong economic growth, 2022 may provide an optimal environment for active, skilled managers to leverage their expertise to identify opportunities among a wide and changing opportunity set.

  • Bloomberg Finance, L.P., as of January 12, 2022. Returns based on the S&P 500 Value Index and S&P 500 Growth Index.

The chart of the week and any accompanying data is for informational purposes only and shall not be considered an investment recommendation or promotion of FS Investments or any FS Investments fund. The chart of the week is subject to change at any time based on market or other conditions, and FS Investments and FS Investment Solutions, LLC disclaim any responsibility to update such market commentary. The chart of the week should not be relied on as investment advice, and because investment decisions for the FS Investments funds are based on numerous factors, may not be relied on as an indication of the investment intent of any FS Investments fund. None of FS Investments, its funds, FS Investment Solutions, LLC or their respective affiliates can be held responsible for any direct or incidental loss incurred as a result of any reliance on the chart of the week or other opinions expressed therein. Any discussion of past performance should not be used as an indicator of future results.

This information is educational in nature and does not constitute a financial promotion, investment advice or an inducement or incitement to participate in any product, offering or investment. FS Investments is not adopting, making a recommendation for or endorsing any investment strategy or particular security. All views, opinions and positions expressed herein are that of the author and do not necessarily reflect the views, opinions or positions of FS Investments. All opinions are subject to change without notice, and you should always obtain current information and perform due diligence before participating in any investment. FS Investments does not provide legal or tax advice and the information herein should not be considered legal or tax advice. Tax laws and regulations are complex and subject to change, which can materially impact any investment result. FS Investments cannot guarantee that the information herein is accurate, complete, or timely. FS Investments makes no warranties with regard to such information or results obtained by its use, and disclaims any liability arising out of your use of, or any tax position taken in reliance on, such information.

Any projections, forecasts and estimates contained herein are based upon certain assumptions that the author considers reasonable. Projections are necessarily speculative in nature, and it can be expected that some or all of the assumptions underlying the projections will not materialize or will vary significantly from actual results. The inclusion of projections herein should not be regarded as a representation or guarantee regarding the reliability, accuracy or completeness of the information contained herein, and neither FS Investments nor the author are under any obligation to update or keep current such information.

All investing is subject to risk, including the possible loss of the money you invest.

Search our site