Chart of the week

Diverging economic forecasts as rate hikes begin?

The Fed liftoff took place as market drivers compete. This week’s chart looks at two as investors manage through an uncertain environment.

March 18, 2022 | 2 minute read

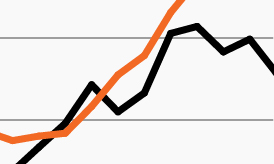
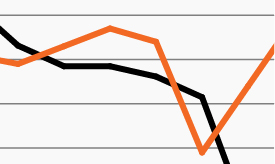
Treasury yield curve and high yield bonds spreads

Source: Federal Reserve Bank of St. Louis, as of March 16, 2022. 2-10 yield curve refers to the 10-year Treasury yield less the 2-year Treasury yield. High yield spread refers to the yield on the ICE BofA U.S. High Yield Index less the risk-free rate. Long-term average refers to the average spread from January 1997–March 2022.

  • Equity and core fixed income markets reacted very differently this week in the face of several high-profile market drivers, including a Fed rate hike, Russian-Ukrainian negotiations and Chinese authorities voicing support for domestic markets. In all, the S&P 500 rose just under 5% while the Agg declined further as bond traders steel themselves for a potential economic slowdown.1
  • The week’s activity has been a microcosm of 2022 as investors have been forced to digest multiple, often competing market drivers. These include healthy U.S. consumer and corporate balance sheets and a strong job market against multi-decade high inflation, the war in Ukraine and tightening monetary policy.
  • Against this backdrop, the spread between long- and short-term Treasury yields (2–10 yield curve) has flattened significantly over the last year, a sign of tightening monetary conditions and, if inverted, historically a precursor to recession.1 Meanwhile, high yield bond spreads have risen this year but remain far below their long-term average and do not yet appear to signal significant economic or corporate stress.
  • No one knows the path of economic growth. Yet it seems fair to say that investors are operating in a significantly more uncertain environment than even in late 2021. Given today’s potential inflection point, investors may be wise to adopt an active approach to navigate quickly changing markets and seek alternative ways to generate returns and manage risk.

  • Federal Reserve Bank of St. Louis, as of March 16, 2022. The Agg refers to the Bloomberg U.S. Aggregate Index.

The chart of the week and any accompanying data is for informational purposes only and shall not be considered an investment recommendation or promotion of FS Investments or any FS Investments fund. The chart of the week is subject to change at any time based on market or other conditions, and FS Investments and FS Investment Solutions, LLC disclaim any responsibility to update such market commentary. The chart of the week should not be relied on as investment advice, and because investment decisions for the FS Investments funds are based on numerous factors, may not be relied on as an indication of the investment intent of any FS Investments fund. None of FS Investments, its funds, FS Investment Solutions, LLC or their respective affiliates can be held responsible for any direct or incidental loss incurred as a result of any reliance on the chart of the week or other opinions expressed therein. Any discussion of past performance should not be used as an indicator of future results.

This information is educational in nature and does not constitute a financial promotion, investment advice or an inducement or incitement to participate in any product, offering or investment. FS Investments is not adopting, making a recommendation for or endorsing any investment strategy or particular security. All views, opinions and positions expressed herein are that of the author and do not necessarily reflect the views, opinions or positions of FS Investments. All opinions are subject to change without notice, and you should always obtain current information and perform due diligence before participating in any investment. FS Investments does not provide legal or tax advice and the information herein should not be considered legal or tax advice. Tax laws and regulations are complex and subject to change, which can materially impact any investment result. FS Investments cannot guarantee that the information herein is accurate, complete, or timely. FS Investments makes no warranties with regard to such information or results obtained by its use, and disclaims any liability arising out of your use of, or any tax position taken in reliance on, such information.

Any projections, forecasts and estimates contained herein are based upon certain assumptions that the author considers reasonable. Projections are necessarily speculative in nature, and it can be expected that some or all of the assumptions underlying the projections will not materialize or will vary significantly from actual results. The inclusion of projections herein should not be regarded as a representation or guarantee regarding the reliability, accuracy or completeness of the information contained herein, and neither FS Investments nor the author are under any obligation to update or keep current such information.

All investing is subject to risk, including the possible loss of the money you invest.

Search our site