Chart of the week

Real yields rise to usher in new market dynamics?

After two years in negative territory, real yields are back to zero. Our chart looks at real yields impact on growth and value stocks.

April 22, 2022 | 2 minute read


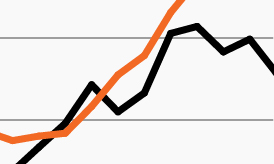
Real yields, growth and value stocks

Source: Bloomberg Finance, L.P., FS Investments, as of April 20, 2022. The S&P 500 Growth Index draws the highest growth-oriented companies from the S&P 500. The S&P 500 Value Index tracks value-oriented companies from the S&P 500. TIPS refers to Treasury Inflation-Protected Securities, whose par, or face, value rises with inflation as measured by the consumer price index.

  • Amid the many quickly evolving market themes investors are watching—the ongoing war in Europe, a volatile commodities complex, expectations for rapid tightening from the Fed, among others—real (inflation-adjusted) yields’ rapid rise may rank among the most important.
  • Real yields, which fell at the onset of the pandemic and remained negative since, have helped support outsized returns among core fixed income and other low-duration investments, including a handful of mega-cap technology stocks.
  • Real yields’ continued rise could create ongoing volatility and threatens to reverse many of the same themes that have driven markets in recent years.
  • For one, it calls into question growth stocks’ return outlook. As the chart shows, growth stocks strongly outperformed value as real yields plummeted in April 2020.1 Since real yields have risen, however, they have traded well off their Q4 2021 high while value has generally moved sideways.
  • As the market and economic environment have evolved the past several years, investors may increasingly have to find new and different sources of return. Today’s backdrop may provide an optimal environment for active, skilled managers to leverage their expertise to identify potential possibilities across a wide and quickly changing opportunity set.

  • Bloomberg Finance, L.P., FS Investments, as of April 20, 2022.

The chart of the week and any accompanying data is for informational purposes only and shall not be considered an investment recommendation or promotion of FS Investments or any FS Investments fund. The chart of the week is subject to change at any time based on market or other conditions, and FS Investments and FS Investment Solutions, LLC disclaim any responsibility to update such market commentary. The chart of the week should not be relied on as investment advice, and because investment decisions for the FS Investments funds are based on numerous factors, may not be relied on as an indication of the investment intent of any FS Investments fund. None of FS Investments, its funds, FS Investment Solutions, LLC or their respective affiliates can be held responsible for any direct or incidental loss incurred as a result of any reliance on the chart of the week or other opinions expressed therein. Any discussion of past performance should not be used as an indicator of future results.

This information is educational in nature and does not constitute a financial promotion, investment advice or an inducement or incitement to participate in any product, offering or investment. FS Investments is not adopting, making a recommendation for or endorsing any investment strategy or particular security. All views, opinions and positions expressed herein are that of the author and do not necessarily reflect the views, opinions or positions of FS Investments. All opinions are subject to change without notice, and you should always obtain current information and perform due diligence before participating in any investment. FS Investments does not provide legal or tax advice and the information herein should not be considered legal or tax advice. Tax laws and regulations are complex and subject to change, which can materially impact any investment result. FS Investments cannot guarantee that the information herein is accurate, complete, or timely. FS Investments makes no warranties with regard to such information or results obtained by its use, and disclaims any liability arising out of your use of, or any tax position taken in reliance on, such information.

Any projections, forecasts and estimates contained herein are based upon certain assumptions that the author considers reasonable. Projections are necessarily speculative in nature, and it can be expected that some or all of the assumptions underlying the projections will not materialize or will vary significantly from actual results. The inclusion of projections herein should not be regarded as a representation or guarantee regarding the reliability, accuracy or completeness of the information contained herein, and neither FS Investments nor the author are under any obligation to update or keep current such information.

All investing is subject to risk, including the possible loss of the money you invest.

Search our site