Chart of the week

As investors seek quality, broadly syndicated loans wilt

As investors seek higher quality investments, this week’s chart looks at the loan market’s gradual move down in quality.

August 5, 2022 | 2 minute read

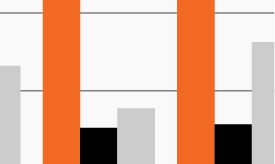
Broadly syndicated loan market exposure by rating

Source: S&P/LSTA Leveraged Loan Index, ICE BofAML U.S. High Yield Index, as of July 31, 2022.  

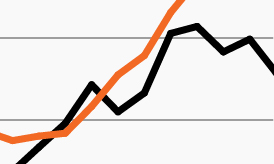
  • Rising rates pressured higher-rated, duration-sensitive bonds early this year. As the market narrative shifted from concerns over rising rates to global growth, investors increasingly favored higher quality assets. Since April, BB-rated bonds have been the top performer while lower-rated credits (bonds and loans) have fared worst.
  • Despite rising rates, loans, typically a beneficiary in such environments given their floating rate nature, are down -2.3% year to date. The decline has been driven in large part by the deterioration in the credit quality of the loan market.1
  • For example, the rise of loan-only issuance (capital structures where there is no other debt subordinate to the loans in a company’s capital structure), which represents 58% of the loan market today compared to just 35% 10 years ago, has skewed the market down in quality.1 As a result, B- or CCC-rated loans represent nearly 70% of the loan index today.1 In contrast, higher-quality BB-rated bonds make up more than half (53%) of the high yield bond index.1
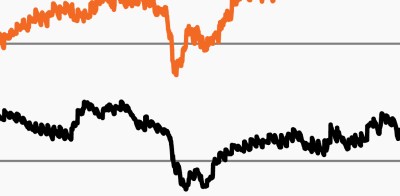
  • Recovery rates represent another sharp divergence between loans and bonds. Loan recovery rates, which measures the percentage of a loan’s initial par value repaid to investors in the case of a default or bankruptcy, have trended notably lower, from an average of 70% throughout the period from 2000—2010 to approximately 63% over the last 12 months.1 High yield bond recovery rates have increased from their 25-year average of approximately 40% to 68% today.1
  • Despite rising market uncertainties, corporate fundamentals remain strong and credit markets are significantly larger and more diverse today compared to just 10 years ago. To access the greatest relative value return opportunities within today’s environment, however, investment selectivity and flexibility remain critically important.

  • Senior secured loans represented by the S&P/LSTA Leveraged Loan Index; high yield bonds represented by the ICE BofAML U.S. High Yield Index. As of July 31, 2022. Current recovery rates represent the trailing 12-month recovery.

The chart of the week and any accompanying data is for informational purposes only and shall not be considered an investment recommendation or promotion of FS Investments or any FS Investments fund. The chart of the week is subject to change at any time based on market or other conditions, and FS Investments and FS Investment Solutions, LLC disclaim any responsibility to update such market commentary. The chart of the week should not be relied on as investment advice, and because investment decisions for the FS Investments funds are based on numerous factors, may not be relied on as an indication of the investment intent of any FS Investments fund. None of FS Investments, its funds, FS Investment Solutions, LLC or their respective affiliates can be held responsible for any direct or incidental loss incurred as a result of any reliance on the chart of the week or other opinions expressed therein. Any discussion of past performance should not be used as an indicator of future results.

This information is educational in nature and does not constitute a financial promotion, investment advice or an inducement or incitement to participate in any product, offering or investment. FS Investments is not adopting, making a recommendation for or endorsing any investment strategy or particular security. All views, opinions and positions expressed herein are that of the author and do not necessarily reflect the views, opinions or positions of FS Investments. All opinions are subject to change without notice, and you should always obtain current information and perform due diligence before participating in any investment. FS Investments does not provide legal or tax advice and the information herein should not be considered legal or tax advice. Tax laws and regulations are complex and subject to change, which can materially impact any investment result. FS Investments cannot guarantee that the information herein is accurate, complete, or timely. FS Investments makes no warranties with regard to such information or results obtained by its use, and disclaims any liability arising out of your use of, or any tax position taken in reliance on, such information.

Any projections, forecasts and estimates contained herein are based upon certain assumptions that the author considers reasonable. Projections are necessarily speculative in nature, and it can be expected that some or all of the assumptions underlying the projections will not materialize or will vary significantly from actual results. The inclusion of projections herein should not be regarded as a representation or guarantee regarding the reliability, accuracy or completeness of the information contained herein, and neither FS Investments nor the author are under any obligation to update or keep current such information.

All investing is subject to risk, including the possible loss of the money you invest.

Search our site