More of our insights
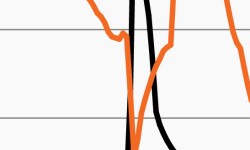
Stocks trapped in (an expensive) trading range?
Stocks have spent the last year range-bound. This week’s chart looks at the challenges they may face moving materially higher.
Family offices to increase allocation to alternatives
This week’s chart looks at institution’s growing interest in alts; they expect to grow allocations to real estate, private debt and private equity.

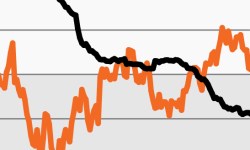
Treasury volatility hits 2008 levels amid macro pressures
Expected Treasury volatility spiked over the past week. This week’s chart looks at the MOVE Index, which rose to its highest point since 2008.
The 3D Report: Q4 2022 recap—We won’t get fooled again
Ryan Caldwell and Lara Rhame reflect on the events of 2022, and how they’ll continue to impact the financial markets in the new year.

Q4 2022 3D Report: We won’t get fooled again
Periods of mean reversion have always been a positive for the Global Allocation space. Read more about why we believe one such period is arriving and the opportunities we see in the global financial markets.

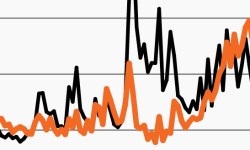
A slog ahead? Leading indicators point to a downturn
Data points toward a potential slog as leading economic indicators weaken. This week’s chart looks at why markets could remain choppy.