More of our insights
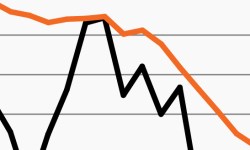
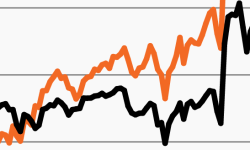
Private markets attractive in market drawdowns?
This week’s chart looks at private markets’ relatively small declines during the past two market drawdowns compared to their public counterparts.
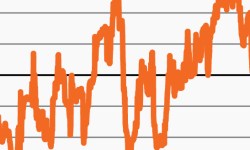
Stock-bond correlation is quickly rising
Stock-bond correlation has been on the rise again. This week’s chart looks at the trend and how it has exacerbated the diversification challenge.
Q2 2023 3D Report: Do LEIs lie?
Are leading economic indicators sending false signals? If not, then Houston we have a problem.

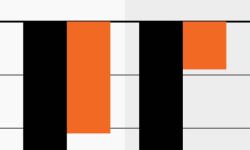
Institutions remain cautious, despite market rally
Market sentiment has shifted recently, but there are still reasons for caution. This week’s chart looks at institutions’ somewhat neutral positioning.
Tech-heavy market accentuates stocks’ rich valuations
Overconcentrated and expensive? This week’s chart looks at valuations on the top 10 S&P stocks vs. the full index.
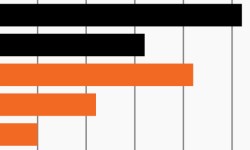
As growth turns higher, leading indicators remain flat
Markets have rallied amid better-than-expected economic data, but leading indicators show little optimism. This week’s chart looks at the growing gap.