Negative equity risk premium highlights investor complacency
The current negative equity risk premium suggests markets may not be sufficiently compensating investors for today’s market and economic risks.

Middle market companies tripled growth of large cap peers
Middle market private equity sponsors have historically provided outsized value compared to their large cap peers.

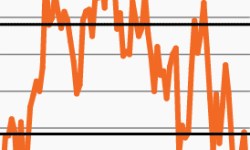
With investor sentiment stretched, time to diversify?
This week’s chart looks at the spread between bullish and bearish investors, which has widened significantly in the past several months.
A compelling growth opportunity in private equity secondaries?
This week’s chart looks at private equity secondaries’ outperformance versus the broader PE market, focusing on what has driven the outperformance.
Private and public company earnings taking divergent paths
This week’s chart looks at a shifting opportunity set as the private middle market shines while small cap company earnings remain challenged.

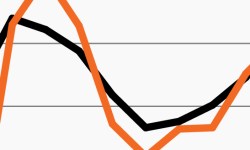
Will a rate-dependent equity market become a headwind?
Could last year’s market tailwind turn into this year’s headwind? This week’s chart looks at stocks and rates’ tandem moves over the past year.
