
When valuations appear expensive, we assume there’s a fundamental reason for it. Where there’s smoke, there must be fire, right? This goes back to financial market basics – that markets are efficient and equity prices take into account all current and expected value. So what is the reason for this relentless march higher of equity valuations?
In this case, we see “smoke” (in the form of stratospheric equity valuations), so there must be “fire” (a resoundingly positive reason why stocks are pricing as they are). The fire could include stronger growth, a more robust economy, an acceleration in productivity growth, or signs of an upswing in earnings or profits, now or in the future.
I counter with a different argument. Right now there’s no fire raging under all this smoke. What we can observe is a series of short-term trends behind stocks’ soaring valuations. Some could have a short-lived positive impact on earnings. Some could be little more than headline distractions. The primary observable long-term trend that closely ties with higher equity prices is the multi-year surge in liquidity from lax global monetary policy.
This isn’t a market call – we have seen markets disconnect from long-term fundamentals over multi-year time horizons. But it’s critical to understand this disconnect to gain better clarity on how it might impact your investment returns.
Three tenuous links to equity valuations
1. The weaker dollar
One important boost to stocks in the first eight months of this year was the weaker U.S. dollar. The dollar exchange rate is often far off the radar screen for U.S. investors buying dollar-denominated stocks in U.S. companies that report their earnings and pay their dividends in dollars. But the S&P 500 Index includes many large multinational companies, meaning the index is highly exposed to the exchange-traded value of the dollar. It may seem counterintuitive, but the dollar’s decline in the first nine months of the year was a fortuitous turn for many firms that have significant sales outside the U.S. However, many of the factors causing the dollar to drop are dissipating, and even reversing, meaning this one particular market movement that gave a positive boost to earnings could easily prove ephemeral.
The dollar fell from a high of 103.2 in early January to 93.0 in November, or 11% on a trade-weighted basis.¹ This is particularly critical for the S&P 500 Index, with companies that earn 44% of their revenue abroad.² Let’s take a simple example of a company that sells its products in the eurozone. The euro began the year at 1.04 versus the dollar, meaning that for every euro of product sold, the U.S. multinational earned $1.04. The dollar steadily fell versus the euro for the first eight months of the year, and by the beginning of September was at $1.20, meaning the exact same one euro sale would have brought home 16 cents more revenue, a 15% increase.
So, strong earnings have not necessarily been supported by a significant improvement in underlying fundamentals, but by a weak dollar that created an inflated revenue picture. Yet this positive news could quickly be offset by the reversal of the trend in the dollar. Many of the factors that led to the dollar’s drop – such as upside surprises in eurozone and Japanese growth and disappointment in pro-growth U.S. policy plans – have now been largely absorbed by markets. Indeed, the dollar has risen since September.
Weaker dollar has benefited companies with a high percentage of foreign revenues
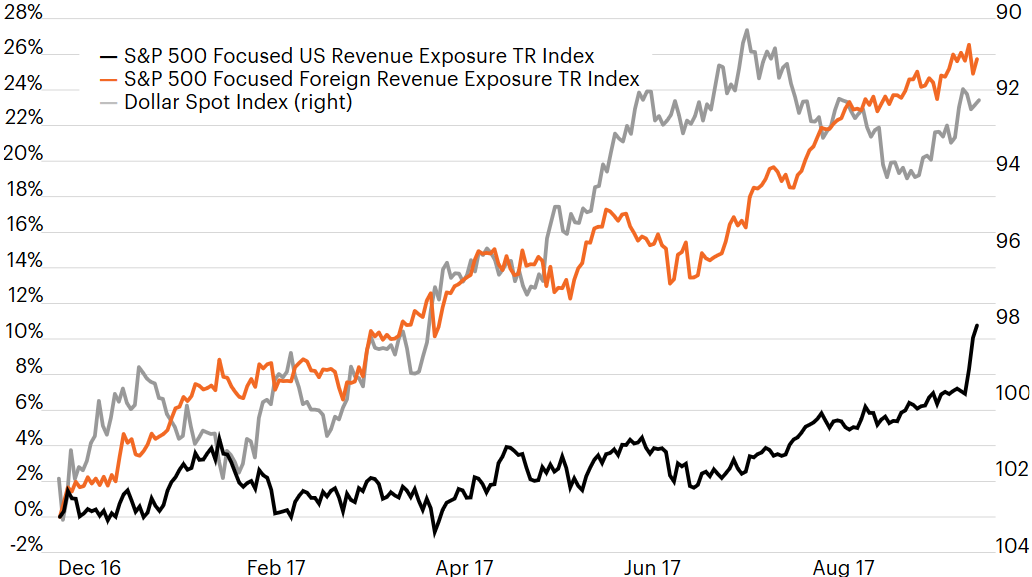
Source: Bloomberg, S&P, as of November 30, 2017.
2. Tax reform
Another common explanation for equity gains is hopes for corporate tax reform or a lower corporate tax rate. Many have credited President Trump’s stated policy plans as contributing to the stock market boom. However, a more thorough analysis shows that a higher-tax basket of stocks has actually underperformed the overall S&P 500 Index until very recently.
We created an index of high-tax stocks by ranking the effective tax rate of all S&P 500 companies, breaking the companies into quartiles based upon their tax rates, and measuring the highest-tax quartile versus the performance of the overall index. Companies that pay the highest taxes, and theoretically would have the most to gain from a corporate tax cut, have underperformed for almost all of 2017. It is only recently, with tax reform being actively debated in Congress, that high tax stocks have seen a meaningful relative value uptick.
The truth is that this year the S&P 500 has finished up each of the 11 months of the year so far,³ meaning that policy momentum may well coincide with a rally, but not necessarily be the cause for the rally. Going forward, it remains to be seen if the recent increase in the cohort of high-tax companies will have staying power, or if a “buy the rumor, sell the fact” pattern will emerge. There are still considerable uncertainties around the final tax policy that will likely be ready for a vote in late December.
Highest-taxed quartile S&P 500 companies vs. total SPY (relative performance)
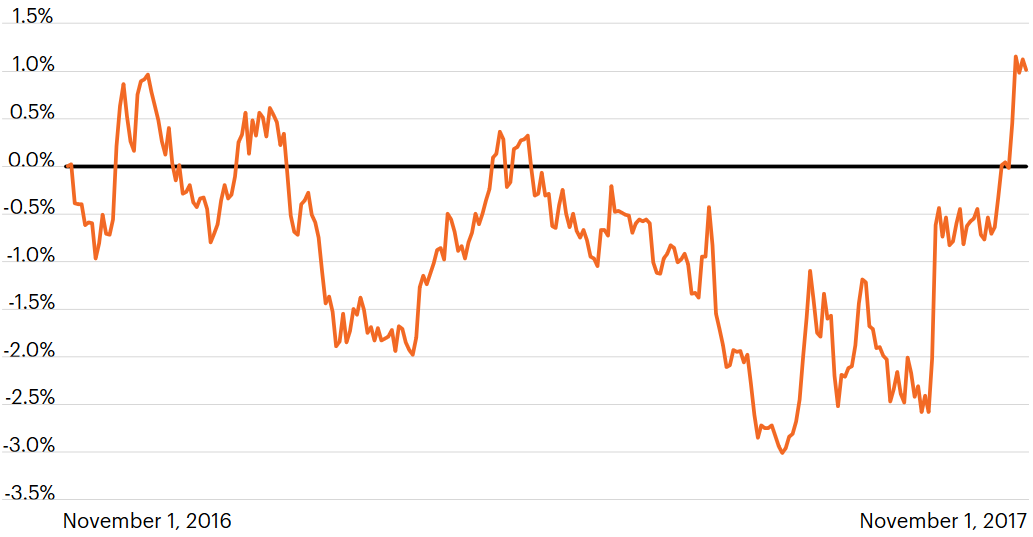
Source: Bloomberg, Capital IQ, S&P, as of November 30, 2017.
Note: Y-axis showed relative performance indexed to November 1, 2016 = 1.
3. The few outperform the many
One important feature of the rally so far this year is that the performance of only a few companies has been exceptional and has meaningfully pulled up the entire index. The performance of the 10 highest-contributing companies accounts for about a third of the S&P’s performance so far in 2017.⁴ This speaks to the difficulty in finding true diversification within the S&P, as well as the domination of a few companies driving the overall index.
Overall, the S&P 500 has risen 20.4% so far this year. But the top 10 contributors, taken together, have risen 42.8%. The rest of the index – imagine an S&P 490, if you will – has risen only 15.5%. In and of itself, this is a strong performance. But the surge in the top performers has distorted the overall index by pulling it over 33% higher still.
Contribution to return
| Avg. weight | YTD return | BPS | % | |
| S&P 500 | 100% | 20.4% | 2,038 | 100% |
| Top 10 contributors | 17.9% | 42.8% | 687 | 33.7% |
| Index excluding top 10 | 82.1% | 15.5% | 1,351 | 66.3% |
Indeed, this has been the trend throughout this rally. The S&P 500’s sharp increases cause the appearance of broad stock gains, while the truth is that gains have been less evenly distributed.
So where’s the fire?
While we have highlighted a few factors that have possibly driven equity prices higher in the first three quarters, the list is made more significant by what is missing. When these factors are peeled away, what we do not find is a meaningful boost in earnings, higher corporate profits, or stronger economic growth. In other words, the increasingly lofty equity valuations in 2017 are underpinned by a slow and low growth economy. Q3 GDP surprised to the upside with a 3.0% read, but GDP is still up only 2.3% y/y. This is close to the 2.1% average since 2010, and forecasts for the coming year are for more of the same, with the Fed expecting 2.1% GDP in 2018.⁵
Globally, economic growth is also improving. But as a whole, developed nations are suffering from the same multi-decade challenges of low population and low productivity growth that are acting like a headwind, offsetting positive economic momentum. In the eurozone, Q3 GDP was 2.0%, a seemingly high level in today’s environment but still well below the current U.S. growth rate, which is also considered anemic by historical standards.
Moreover, corporate revenue and profits are directly tied to growth in the long term. We see that U.S. corporate profits have not improved significantly since 2012, and have been stuck between $2.00–$2.25 trillion for the past five years. The good news is that the economy is not overheating. The bad news is that it is not growing enough to support a near-term (or perhaps even a long-term) spike in earnings.
Liquidity masquerades as fire
What we have analyzed are three reasons often cited for higher equity valuations. The weaker dollar is likely transitory, tax reform is tenuous, and outperformance of specific stocks is largely technical. What we do not see is an improvement in economic growth, high productivity, improved corporate profits or better earnings growth. One overarching trend unique to this expansion has the potential to be a powerful driver of higher equity prices: the massive amount of liquidity resulting from accommodative monetary policy in the developed world.
The three global central banks – the Fed, the European Central Bank (ECB) and the Bank of Japan (BoJ) – have together increased their balance sheets to over $14 trillion, and that sum is still growing. This excess liquidity, initially meant to keep long-term interest rates low, is causing monetary conditions to be supportive of all asset prices, particularly equity prices.
In the years after the financial crisis, the Federal Reserve initiated the extraordinary monetary policy measure of buying U.S. Treasuries and mortgage-backed securities. By the end of 2014, just as the Fed stopped adding to its balance sheet, the ECB picked up the baton and initiated another significant round of quantitative easing. And the BoJ, for its part, had been adding to its balance sheet all along. The three banks together, shown in the graph below, have been pumping liquidity into our global asset markets at an unprecedented rate, particularly over the last two years.
Yet these policies are slowly winding down. This quarter, the Fed will start renormalizing its balance sheet, which will slowly chip away at its $4.4 trillion mountain of assets. On October 26, the ECB announced it will slow its pace of purchases, although its policy will remain accommodative. Together as a group, the G3 balance sheet looks set to edge slightly higher in 2018, but at nowhere near the pace seen since 2015.
G3 asset purchases continue to drive stocks higher
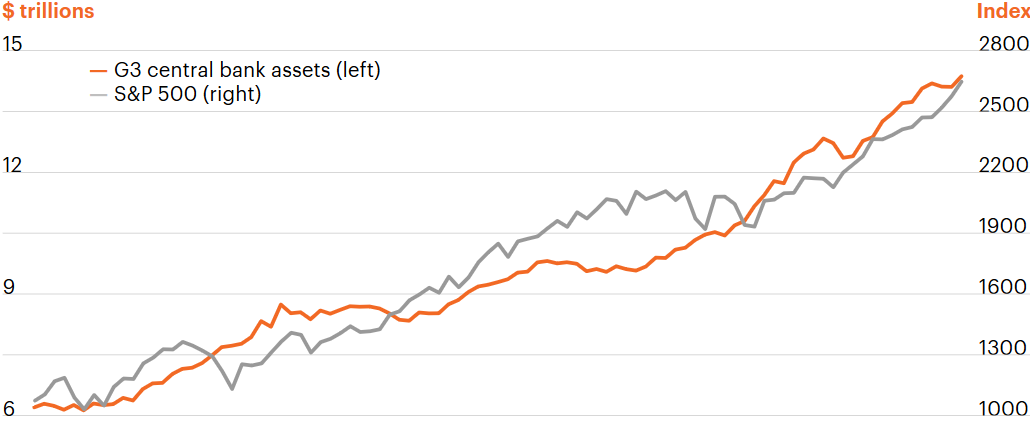
Source: Macrobond, Federal Reserve, Bank of Japan, European Central Bank. As of November 30, 2017.
Note: G3 Central Bank Reserves on left axis, S&P 500 on right axis.
It remains to be seen what impact this will have on equity markets, which have gotten addicted to fresh infusions of liquidity. Of all the explanations for higher valuations, this is the most logical, and yet the most disconnected from fundamentals.