GDP spikes haven’t altered the low-growth landscape
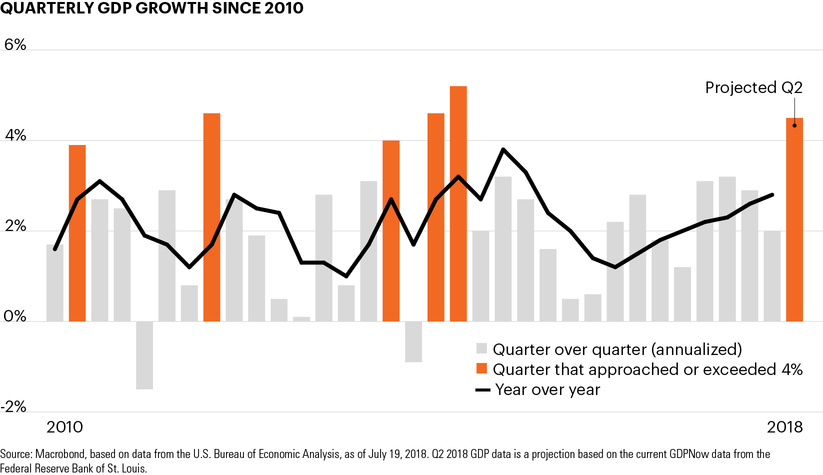
Quarterly GDP growth since 2010
July 20, 2018 | 1 minute read
Federal Reserve Chair Jerome Powell delivered an upbeat assessment of the U.S. economy in two presentations to Congress this week as newly released data supported his outlook.1 Retail sales in June, for example, reached its highest annual growth rate since early 2012 while initial jobless claims last week fell to a near 50-year low.2,3
The Federal Reserve Bank of St. Louis’s GDPNow tracker estimates that Q2 economic growth, to be released next week, will be 4.5%, which marks the model’s highest forecast since Q4 2011.4
U.S. GDP has spiked several times since 2010. As the chart shows for this time frame, there have been five quarters before Q2 2018 where GDP growth either approached or exceeded 4%.5 In each case, growth slowed significantly the following quarter. Over the entire period, GDP growth has averaged a meager 2.2%.5
The Fed continues to project a gradual slowdown in the coming years, with a projected longer-run economic growth rate of just 1.8%.6 At the same time, 10-year U.S. Treasury yields, which often serve as a proxy for expected economic growth, sit near the lower end of their recent 2.8%–3.1% trading range.7
Thanks to recent tax changes and fiscal policies, economic growth may well be above trend in 2018. As the stimulative effects of these policies wear off over time, however, investors may need to position their portfolios for a low-growth environment over the long term.