Chart of the week

The bond market sees exponential growth in the past decade

As traditional fixed income lags, see why actively managed strategies may offer better opportunities in the bond market.

November 16, 2018 | 2 minute read
Outstandings by asset class
  • The performance of traditional fixed income investments so far in 2018 highlights the difficulties investors have faced over the past several years.
  • For example, the Bloomberg Barclays U.S. Aggregate Bond Index, the benchmark for a traditional fixed income portfolio, has returned -2.2% YTD as interest rates have gradually edged higher.1 Looking over the past 5 years, the index’s average yield is just 2.4%, with annualized total returns of 1.6%, compared to a yield of 6.6% the prior 30 years and a significantly higher total return of 8.1%.2
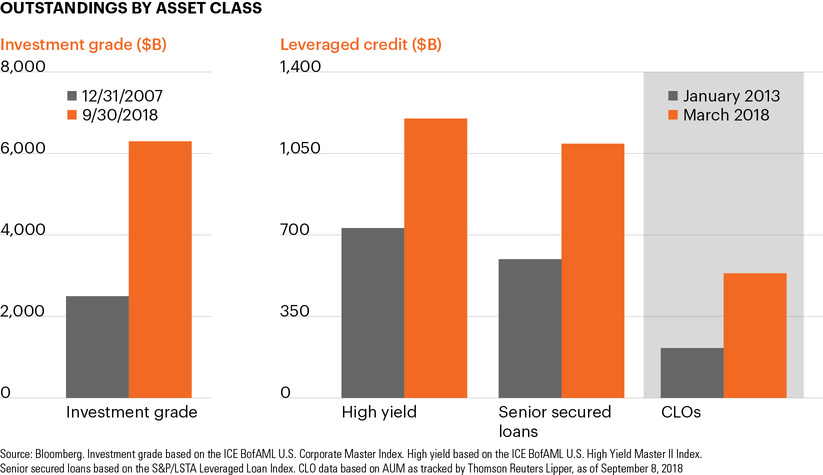
  • Investors looking for income and return opportunities today increasingly may need to look outside core fixed income markets. Fortunately, doing so has become a more realistic option as these asset classes, including high yield bonds, senior secured loans, structured products and emerging market debt, represent a broad, $6.5 trillion market.3
  • The chart shows the exponential growth in several of these markets over the past decade. The high yield bond market grew 64%, from approximately $730 billion in 2008 to $1.2 trillion as of Q3 2018. Meanwhile, the senior secured loan market nearly doubled in size in the same time frame while CLOs have done so since January 2013.4
  • Over the last 10 years, index mutual funds and ETFs have been created to track these markets as well as others outside of core U.S. fixed income. However, many of these investment options focus only on the most liquid segments of the credit markets.
  • An actively managed investment strategy may help investors gain exposure to less-liquid and harder-to-access areas of the credit markets both within and beyond the benchmark indices.

  • Bloomberg, as of November 15, 2018.

  • Last 5 years represents December 31, 2012 to September 30, 2018. Prior 30 years is from December 31, 1982 to December 31, 2012.

  • As of December 31, 2017, representing emerging market government debt, emerging market corporate debt, U.S. high yield bonds, U.S. senior secured loans, European high yield bonds, European senior secured loans, U.S. distressed high yield bonds, and asset-backed securities.

  • Bloomberg and S&P Global Market Intelligence, as of September 8, 2018. Investment grade based on the ICE BofAML U.S. Corporate Master Index. High yield based on the ICE BofAML U.S. High Yield Master II Index. Senior secured loans based on the S&P/LSTA Leveraged Loan Index. CLOs based on the J.P. Morgan CLO Index.

The chart of the week and any accompanying data is for informational purposes only and shall not be considered an investment recommendation or promotion of FS Investments or any FS Investments fund. The chart of the week is subject to change at any time based on market or other conditions, and FS Investments and FS Investment Solutions, LLC disclaim any responsibility to update such market commentary. The chart of the week should not be relied on as investment advice, and because investment decisions for the FS Investments funds are based on numerous factors, may not be relied on as an indication of the investment intent of any FS Investments fund. None of FS Investments, its funds, FS Investment Solutions, LLC or their respective affiliates can be held responsible for any direct or incidental loss incurred as a result of any reliance on the chart of the week or other opinions expressed therein. Any discussion of past performance should not be used as an indicator of future results.

This information is educational in nature and does not constitute a financial promotion, investment advice or an inducement or incitement to participate in any product, offering or investment. FS Investments is not adopting, making a recommendation for or endorsing any investment strategy or particular security. All views, opinions and positions expressed herein are that of the author and do not necessarily reflect the views, opinions or positions of FS Investments. All opinions are subject to change without notice, and you should always obtain current information and perform due diligence before participating in any investment. FS Investments does not provide legal or tax advice and the information herein should not be considered legal or tax advice. Tax laws and regulations are complex and subject to change, which can materially impact any investment result. FS Investments cannot guarantee that the information herein is accurate, complete, or timely. FS Investments makes no warranties with regard to such information or results obtained by its use, and disclaims any liability arising out of your use of, or any tax position taken in reliance on, such information.

Any projections, forecasts and estimates contained herein are based upon certain assumptions that the author considers reasonable. Projections are necessarily speculative in nature, and it can be expected that some or all of the assumptions underlying the projections will not materialize or will vary significantly from actual results. The inclusion of projections herein should not be regarded as a representation or guarantee regarding the reliability, accuracy or completeness of the information contained herein, and neither FS Investments nor the author are under any obligation to update or keep current such information.

All investing is subject to risk, including the possible loss of the money you invest.

Search our site