Chart of the week

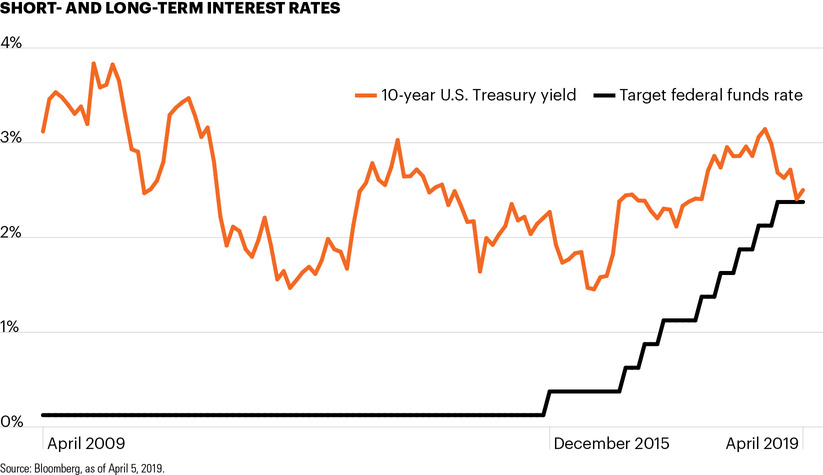
10-year yields see little movement over the past decade

With interest rates hovering at such persistently low levels through the past decade and with little expectation for any increase in short-term rates, investors could continue to face difficulties generating income within their traditional fixed income allocations.

April 5, 2019 | 1 minute read
Short- and long-term interest rates
  • Despite the 10-year U.S. Treasury yield gathering some upward momentum this week, March’s steep monthly decline punctuated the trend of sustained low rates that has been in place for the past decade. During that time, the 10-year has traded within a broad range of 2%–3.5%, with brief outliers both above and below.1
  • Today, the 10-year yield is just 2.50%, approximately 15 bps below where it was 10 years ago.1 As the chart shows, the Fed’s nine rate hikes since December 2015 have had little effect on long-term rates – with 10-year yields sitting just 23 bps above the levels at year-end 2015.1
  • Investor sentiment shifted rapidly this year. Heading into 2019, markets were pricing in further rate hikes. Following the Fed meeting in March and several statements from policymakers, expectations have reversed, with markets pricing in a rate cut later this year.2 This change comes as the amount of negative-yielding debt around the world is approaching $10 trillion once again, a level last seen in Q4 2015.2
  • With interest rates hovering at such persistently low levels through the past decade and with little expectation for any increase in short-term rates, investors could continue to face difficulties generating income within their traditional fixed income allocations.

The chart of the week and any accompanying data is for informational purposes only and shall not be considered an investment recommendation or promotion of FS Investments or any FS Investments fund. The chart of the week is subject to change at any time based on market or other conditions, and FS Investments and FS Investment Solutions, LLC disclaim any responsibility to update such market commentary. The chart of the week should not be relied on as investment advice, and because investment decisions for the FS Investments funds are based on numerous factors, may not be relied on as an indication of the investment intent of any FS Investments fund. None of FS Investments, its funds, FS Investment Solutions, LLC or their respective affiliates can be held responsible for any direct or incidental loss incurred as a result of any reliance on the chart of the week or other opinions expressed therein. Any discussion of past performance should not be used as an indicator of future results.

This information is educational in nature and does not constitute a financial promotion, investment advice or an inducement or incitement to participate in any product, offering or investment. FS Investments is not adopting, making a recommendation for or endorsing any investment strategy or particular security. All views, opinions and positions expressed herein are that of the author and do not necessarily reflect the views, opinions or positions of FS Investments. All opinions are subject to change without notice, and you should always obtain current information and perform due diligence before participating in any investment. FS Investments does not provide legal or tax advice and the information herein should not be considered legal or tax advice. Tax laws and regulations are complex and subject to change, which can materially impact any investment result. FS Investments cannot guarantee that the information herein is accurate, complete, or timely. FS Investments makes no warranties with regard to such information or results obtained by its use, and disclaims any liability arising out of your use of, or any tax position taken in reliance on, such information.

Any projections, forecasts and estimates contained herein are based upon certain assumptions that the author considers reasonable. Projections are necessarily speculative in nature, and it can be expected that some or all of the assumptions underlying the projections will not materialize or will vary significantly from actual results. The inclusion of projections herein should not be regarded as a representation or guarantee regarding the reliability, accuracy or completeness of the information contained herein, and neither FS Investments nor the author are under any obligation to update or keep current such information.

All investing is subject to risk, including the possible loss of the money you invest.

Search our site