Chart of the week

Bonds face shifting macro landscape amid equity volatility declines

See why investors seeking stable income may need to look outside of traditional fixed income markets to find it in today’s environment.

November 15, 2019 | 2 minute read
  • Stocks are up more than 4% since the start of October, bolstered recently by a better-than-expected Q3 corporate earnings season, firming U.S. economic data and increased hopes that the U.S. and China will finalize a “phase one” trade deal later this month.
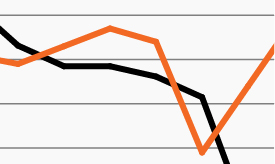
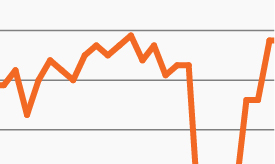
  • Against this backdrop, stock market volatility hit a three-month low this week and has been gradually falling since August. In stark contrast, expected volatility within the bond market, as represented by the MOVE Index in the chart, spiked in May and has remained volatile through the second half of 2019.1
  • Unlike stocks, which saw a relatively steady rise this year, bond markets absorbed the brunt of shifting central bank policies and declining global growth expectations. In late May and again in late July, for example, markets quickly priced in Fed rate cuts as economic data and trade conditions soured. Since early October, bond markets digested an approximately 45 bps rebound in 10-year Treasury yields as trade tensions eased and economic data improved.
  • For much of this year, government bond yields have been flashing a caution sign as equity markets raced ahead. Year-to-date returns across major fixed income indexes have been healthy. However, they were also characterized by periods of significant volatility and notable divergences across sectors and by credit rating.
  • Investors typically seek competitive levels of stable income from their fixed income investments. They may need to look outside traditional markets to find it in today’s environment.

  • Stock market volatility represented by the Chicago Board Options Exchange (CBOE) Volatility Index, or VIX. Bond market volatility represented by the ICE BofAML U.S. Bond Market Option Volatility Estimate (MOVE) Index.

The chart of the week and any accompanying data is for informational purposes only and shall not be considered an investment recommendation or promotion of FS Investments or any FS Investments fund. The chart of the week is subject to change at any time based on market or other conditions, and FS Investments and FS Investment Solutions, LLC disclaim any responsibility to update such market commentary. The chart of the week should not be relied on as investment advice, and because investment decisions for the FS Investments funds are based on numerous factors, may not be relied on as an indication of the investment intent of any FS Investments fund. None of FS Investments, its funds, FS Investment Solutions, LLC or their respective affiliates can be held responsible for any direct or incidental loss incurred as a result of any reliance on the chart of the week or other opinions expressed therein. Any discussion of past performance should not be used as an indicator of future results.

This information is educational in nature and does not constitute a financial promotion, investment advice or an inducement or incitement to participate in any product, offering or investment. FS Investments is not adopting, making a recommendation for or endorsing any investment strategy or particular security. All views, opinions and positions expressed herein are that of the author and do not necessarily reflect the views, opinions or positions of FS Investments. All opinions are subject to change without notice, and you should always obtain current information and perform due diligence before participating in any investment. FS Investments does not provide legal or tax advice and the information herein should not be considered legal or tax advice. Tax laws and regulations are complex and subject to change, which can materially impact any investment result. FS Investments cannot guarantee that the information herein is accurate, complete, or timely. FS Investments makes no warranties with regard to such information or results obtained by its use, and disclaims any liability arising out of your use of, or any tax position taken in reliance on, such information.

Any projections, forecasts and estimates contained herein are based upon certain assumptions that the author considers reasonable. Projections are necessarily speculative in nature, and it can be expected that some or all of the assumptions underlying the projections will not materialize or will vary significantly from actual results. The inclusion of projections herein should not be regarded as a representation or guarantee regarding the reliability, accuracy or completeness of the information contained herein, and neither FS Investments nor the author are under any obligation to update or keep current such information.

All investing is subject to risk, including the possible loss of the money you invest.

Search our site