Chart of the week

Alternative lenders fill a growing CRE lending void

As CRE deal volume shows signs of thawing, alternative lenders sit in an excellent position to capture attractive income opportunities.

Subscribe to the Chart of the week newsletter
August 30, 2024 | 2 minute read

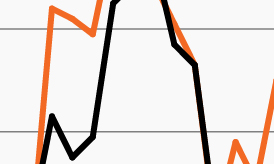
Share of non-agency CRE loan originations

Column chart contrasting CRE loan originations during the first half of 2023 and 2024. Alternative lenders spiked from 23% of origination during the first half of last year to 40% during the first half of this year.  Meanwhile, banks saw a commensurate decline from 42% during 1H 2023 to 26% in 1H2024. Insurance and CMBS originations remained relatively static over the same timeframes.

Source: CBRE as of June 30, 2024, latest data available. Chart shows average loan origination by lender type during the first half of 2023 and 2024.

  • Sentiment among commercial real estate market participants notably improved in recent quarters as optimism has grown that the market is nearing the nadir of its years-long correction.
  • Monthly CRE property prices turned slightly higher in May 2024 and have seen steady but modest increases in the three months since, as fundamentals outside of Office continue to lend support to the market. Meanwhile, transaction volume has shown signs of thawing as investors prepare for the Fed to enact a new rate cutting cycle in September.
  • As deal volume picks up, borrowers will likely find a different lending environment from that of several years ago. Banks have maintained a cautious approach to CRE lending, with some freeing up risk capacity through risk transfers and outright loan sales this year.
  • While banks’ share of CRE loan originations nearly halved during the first half of 2024 compared to the same period in 2023, alternative lenders have increasingly stepped in.1 As the chart shows, alternative lenders’ share of CRE loan origination jumped from just 23% during the first half of 2023 to 40% during the same period in 2024.1
  • The income potential in CRE lending continues to be as attractive as it has been in years as base rates remain elevated. Within this environment, alternative lenders are in an excellent position to take advantage of income opportunities as the outlook for transaction volume improves.

  • CBRE as of June 30, 2024, latest data available. Based on average loan origination by category during the first half of 2023 and 2024.

The chart of the week and any accompanying data is for informational purposes only and shall not be considered an investment recommendation or promotion of FS Investments or any FS Investments fund. The chart of the week is subject to change at any time based on market or other conditions, and FS Investments and FS Investment Solutions, LLC disclaim any responsibility to update such market commentary. The chart of the week should not be relied on as investment advice, and because investment decisions for the FS Investments funds are based on numerous factors, may not be relied on as an indication of the investment intent of any FS Investments fund. None of FS Investments, its funds, FS Investment Solutions, LLC or their respective affiliates can be held responsible for any direct or incidental loss incurred as a result of any reliance on the chart of the week or other opinions expressed therein. Any discussion of past performance should not be used as an indicator of future results.

This information is educational in nature and does not constitute a financial promotion, investment advice or an inducement or incitement to participate in any product, offering or investment. FS Investments is not adopting, making a recommendation for or endorsing any investment strategy or particular security. All views, opinions and positions expressed herein are that of the author and do not necessarily reflect the views, opinions or positions of FS Investments. All opinions are subject to change without notice, and you should always obtain current information and perform due diligence before participating in any investment. FS Investments does not provide legal or tax advice and the information herein should not be considered legal or tax advice. Tax laws and regulations are complex and subject to change, which can materially impact any investment result. FS Investments cannot guarantee that the information herein is accurate, complete, or timely. FS Investments makes no warranties with regard to such information or results obtained by its use, and disclaims any liability arising out of your use of, or any tax position taken in reliance on, such information.

Any projections, forecasts and estimates contained herein are based upon certain assumptions that the author considers reasonable. Projections are necessarily speculative in nature, and it can be expected that some or all of the assumptions underlying the projections will not materialize or will vary significantly from actual results. The inclusion of projections herein should not be regarded as a representation or guarantee regarding the reliability, accuracy or completeness of the information contained herein, and neither FS Investments nor the author are under any obligation to update or keep current such information.

All investing is subject to risk, including the possible loss of the money you invest.

Search our site