So far, 2017 feels different than prior years. The optimism in business, consumer and investor surveys contrasts with hard data showing underwhelming growth. Some see this divide as a tug of war and are investing by taking sides on who will “win” – the optimists following sentiment data or the pessimists following the “hard” economic data. But this either/or thinking can keep investors from tying investment decisions to realistic goals.
Survey says…
A wide variety of recent survey and sentiment data shows increased business optimism and strong consumer and investor confidence. However, measures of actual economic output point to a more muted performance. These conflicting data streams have caused a kind of economic argument to unfold: Is Q1 growth data too pessimistic or is rising consumer and business sentiment overshooting the true potential of future growth?
First, let’s take a step back. Economic data often occupy two categories.
Survey data that measure sentiment or expectations are generally qualitative and use a smaller sample size, but are timelier. Take, for example, an important consumer confidence index compiled by the Conference Board. The organization surveys approximately 3,000 households on feelings about employment, business conditions and family income both now and in the next 6 months. Only three response options – positive, negative or neutral – are offered. Many regional and national business surveys are also widely followed, as well as other qualitative surveys of CEOs and homebuilders.
We refer to the other large basket of data as “hard” because it’s calculated from actual economic activity. The hard data counterpart to consumer confidence is consumption as measured by advanced retail sales – sales activity collected from approximately 4,700 establishments. An even more complete picture of consumption emerges with a later release called personal consumption expenditures, which includes national data from a wide variety of government offices as well as trade associations.¹
This pattern becomes familiar: survey data with smaller sample sizes and simple, qualitative questions are released sooner while broader, accounting-based statistics take longer to compile and release. You can repeat this for other sectors of the economy such as business investment, construction activity and the housing sector.
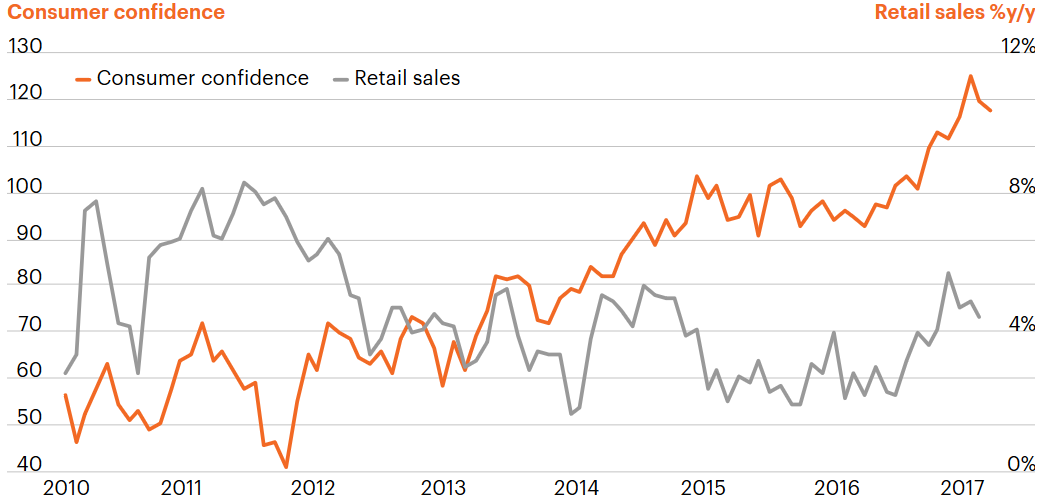
Sentiment is surging, but spending is subdued

Source: Macrobond, as of May 31, 2017.
Glass half full or half empty?
Data in 2017 have been notable for sending mixed signals. Confidence data have sharply improved, yet hard data have shown significantly less pep. Moreover, this is apparent in most sectors of the economy. Here are a few examples:
Consumers: Consumer confidence shot higher in the first quarter, with the Conference Board’s measure reaching 124.9, a 17-year high.² Retail sales, however, have been stagnant relative to prior expansions, and in Q1, personal consumption expenditures rose only 0.6%, a tepid gain.³
Businesses: Business confidence indexes soared in the first quarter, and while they have retraced a tad, sentiment remains elevated. The large national manufacturing and service indicators, like the ISM, hit a two-and-a-half year high in February,⁴ and some regional manufacturing surveys were even stronger, including the Philly Fed index, which surged to a 33-year high in the same month.⁵ However, business spending for manufacturing companies (capex) has not meaningfully increased over the past four years.⁶
Housing and construction: The Housing Market Index,⁷ which measures home builders’ sentiment, hit an 11-year high in March, matching pre-recession levels. However, while housing starts have shown a slow and steady recovery throughout this expansion, they averaged 1.24 million in the first quarter,⁸ well below the average of the prior six expansions.
Time to rethink both perception and reality
Optimism is critical for our economic health. For consumers, optimism drives spending, which supports economic growth. Big spending decisions, like buying a car or a house, are aligned with optimism about the future. For businesses, a positive outlook is necessary to justify capital spending and investment, which not only adds to economic activity, but is critical to increasing productivity. Yet some of the optimism in the early 2017 surveys may reflect a post-election surge based on expectations of rapid legislation to cut taxes or reduce regulation. In particular, a hoped-for fiscal stimulus package to drive GDP higher may not materialize until late 2017 at the earliest.
However, the real issue is that hard data reflecting current growth rates of around 2% should not be viewed as pessimistic. The economy is closing in on full employment and the household balance sheet is looking healthy. These positives will bolster consumption. Interest rates are low, which should continue to support investment. The Fed currently estimates that potential growth – the rate at which our economy can grow without generating inflation – is 1.8%.⁹ With slowing labor force growth and low productivity, 2% growth is actually not pessimistic but, rather, realistic.
When I meet with investors on the road, I can feel a tug of war between those who are optimistic about the economy and those who are pessimistic. The data show a similar split between euphoric perception and more subdued hard data. In the end, optimism is critical, but investing in reality should not imply pessimism. The challenges posed by low growth unfortunately cannot be fixed by optimism alone, but necessitate reality-based smart portfolio construction.


