Chart of the week

As private credit grows, underwriting standards remain healthy

Lenders requiring more equity and less leverage, suggesting healthy private credit lending standards.

May 10, 2024 | 2 minute read

Equity, leverage requirements in deals by year

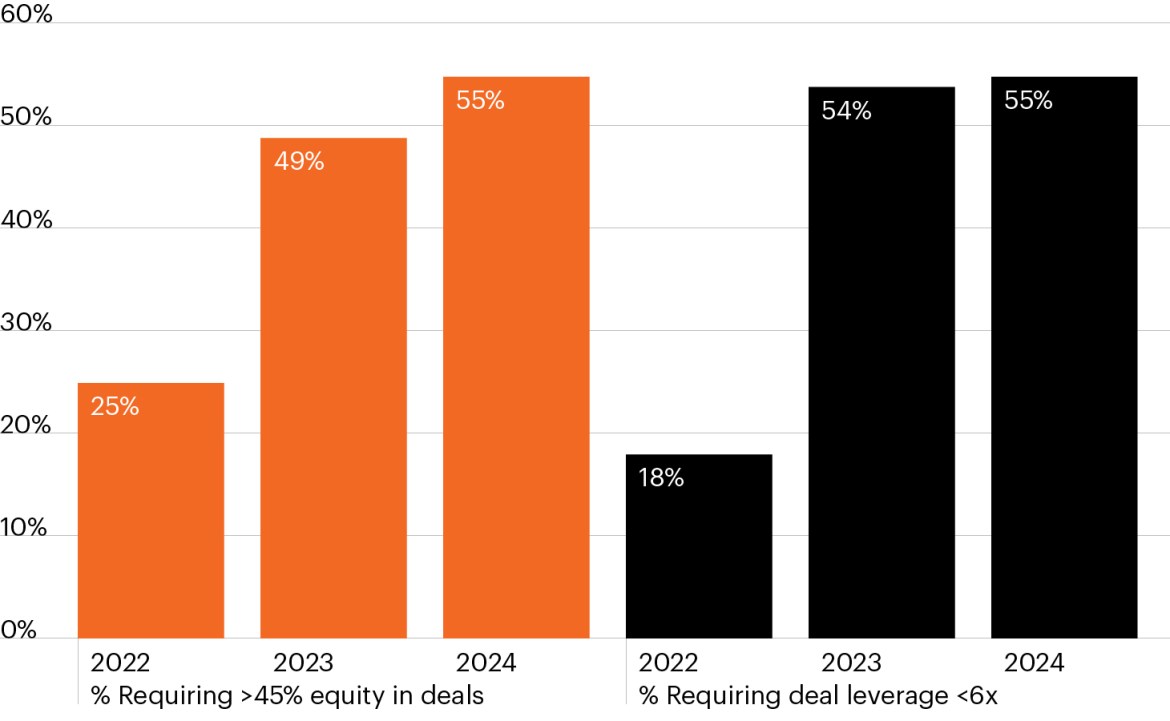
Source: Proskauer, as of Q1 2024.

  • The private credit asset class has grown from a niche corner of institutional investor portfolios to a multitrillion dollar market accessed by a wide variety of investors. This extraordinary growth has led to questions about whether this market could represent a bubble.
  • When comparing historical bubbles to today’s credit landscape, however, the differences are stark.
  • Total private sector debt-to-GDP increased just 1% during the past decade, a period when the size of U.S. private credit grew more than fourfold.1 The lack of growth in private sector indebtedness contrasts starkly with historical bubbles (Great Depression and the Global Financial Crisis) and may defy the notion that private credit is fueling a bubble.
  • Perhaps most importantly, lenders tightened underwriting guidelines over the past two years. As the chart shows, lenders are demanding more equity and lower earnings leverage in deals, which is a clear contrast from the trend toward deteriorating underwriting standards that marks the most prominent bubbles.2
  • Private credit’s impressive growth has been driven by broad private asset growth, a restrained banking sector and healthy demand for financing. Hard data exploring private credit trends, however, do not point toward an inflating bubble

  • Persons, Charles E., Credit Expansion, 1920 to 1929, and its Lessons. The Quarterly Journal of Economics. pp.94–130. “The Paradox of Debt: A New Path to Prosperity Without Crisis.” University of Pennsylvania Press. 2023. Tychos Group. “Summary of United States Debt.” Q4 2023.

  • Proskauer, as of Q4 2023.

The chart of the week and any accompanying data is for informational purposes only and shall not be considered an investment recommendation or promotion of FS Investments or any FS Investments fund. The chart of the week is subject to change at any time based on market or other conditions, and FS Investments and FS Investment Solutions, LLC disclaim any responsibility to update such market commentary. The chart of the week should not be relied on as investment advice, and because investment decisions for the FS Investments funds are based on numerous factors, may not be relied on as an indication of the investment intent of any FS Investments fund. None of FS Investments, its funds, FS Investment Solutions, LLC or their respective affiliates can be held responsible for any direct or incidental loss incurred as a result of any reliance on the chart of the week or other opinions expressed therein. Any discussion of past performance should not be used as an indicator of future results.

This information is educational in nature and does not constitute a financial promotion, investment advice or an inducement or incitement to participate in any product, offering or investment. FS Investments is not adopting, making a recommendation for or endorsing any investment strategy or particular security. All views, opinions and positions expressed herein are that of the author and do not necessarily reflect the views, opinions or positions of FS Investments. All opinions are subject to change without notice, and you should always obtain current information and perform due diligence before participating in any investment. FS Investments does not provide legal or tax advice and the information herein should not be considered legal or tax advice. Tax laws and regulations are complex and subject to change, which can materially impact any investment result. FS Investments cannot guarantee that the information herein is accurate, complete, or timely. FS Investments makes no warranties with regard to such information or results obtained by its use, and disclaims any liability arising out of your use of, or any tax position taken in reliance on, such information.

Any projections, forecasts and estimates contained herein are based upon certain assumptions that the author considers reasonable. Projections are necessarily speculative in nature, and it can be expected that some or all of the assumptions underlying the projections will not materialize or will vary significantly from actual results. The inclusion of projections herein should not be regarded as a representation or guarantee regarding the reliability, accuracy or completeness of the information contained herein, and neither FS Investments nor the author are under any obligation to update or keep current such information.

All investing is subject to risk, including the possible loss of the money you invest.

Search our site