Chart of the week

Cash left behind amid rapid market rotation?

Money market fund AUM is rising, even as yields decline, setting up an environment where investors could be subject to significant opportunity cost.

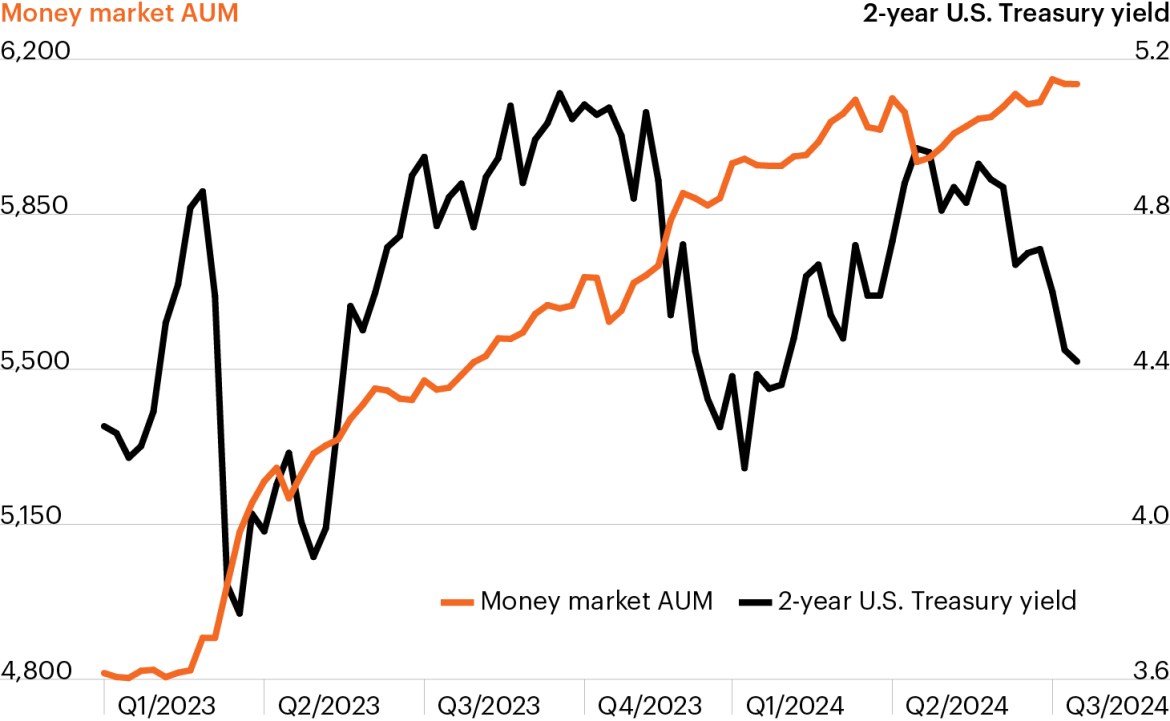
Money market assets under management and 2-year U.S. Treasury yield

Line chart showing money market funds assets under management growing steadily since January 2023, from $4.9 trillion to just over $6.1 trillion as of July 2024. While investors have been plowing money into cash, Treasury yields have stepped down -55 basis points since mid-April. Declining inflation readings suggest cash could also become less attractive.

Source: Bloomberg Finance, L.P., as of July 17, 2024.

  • Fed policymakers have struck a more dovish tone following last week’s downside inflation surprise as they prepare for a potential rate cut as soon as September. But markets do not appear to be waiting for the Fed, staging a remarkable rotation in just a week.
  • Small cap stocks have quickly come back to life following an extended period in which mega-cap Magnificent 7 stocks drove nearly all equity returns. In the week since June inflation data was released, the Russell 2000 Index (+9.17%) has far outpaced the S&P 500 (-0.80%).1
  • Meanwhile, yields on shorter-dated Treasuries have fallen notably. The 2-year Treasury yield has declined -55bps since mid-April and -69bps since its September 2023 peak.1 Investors have been slow to react, as cash continues to see massive inflows and money market fund assets under management recently topping the $6.1 trillion mark.1
  • Cash became a preferred allocation for many investors as the economic fragility of the first half of 2024 evolved into a higher-for-longer rate environment. Yet this past week’s market activity suggests this environment (and thus much of cash’s appeal) may have come to an end.
  • Investors should remain mindful of the potentially significant opportunity costs of holding too much cash. Alternative investments that provide less-correlated sources of income and total return may provide attractive entry points for many investors seeking to redeploy cash allocations.

  • Bloomberg Finance, L.P., as of July 17, 2024.

The chart of the week and any accompanying data is for informational purposes only and shall not be considered an investment recommendation or promotion of FS Investments or any FS Investments fund. The chart of the week is subject to change at any time based on market or other conditions, and FS Investments and FS Investment Solutions, LLC disclaim any responsibility to update such market commentary. The chart of the week should not be relied on as investment advice, and because investment decisions for the FS Investments funds are based on numerous factors, may not be relied on as an indication of the investment intent of any FS Investments fund. None of FS Investments, its funds, FS Investment Solutions, LLC or their respective affiliates can be held responsible for any direct or incidental loss incurred as a result of any reliance on the chart of the week or other opinions expressed therein. Any discussion of past performance should not be used as an indicator of future results.

This information is educational in nature and does not constitute a financial promotion, investment advice or an inducement or incitement to participate in any product, offering or investment. FS Investments is not adopting, making a recommendation for or endorsing any investment strategy or particular security. All views, opinions and positions expressed herein are that of the author and do not necessarily reflect the views, opinions or positions of FS Investments. All opinions are subject to change without notice, and you should always obtain current information and perform due diligence before participating in any investment. FS Investments does not provide legal or tax advice and the information herein should not be considered legal or tax advice. Tax laws and regulations are complex and subject to change, which can materially impact any investment result. FS Investments cannot guarantee that the information herein is accurate, complete, or timely. FS Investments makes no warranties with regard to such information or results obtained by its use, and disclaims any liability arising out of your use of, or any tax position taken in reliance on, such information.

Any projections, forecasts and estimates contained herein are based upon certain assumptions that the author considers reasonable. Projections are necessarily speculative in nature, and it can be expected that some or all of the assumptions underlying the projections will not materialize or will vary significantly from actual results. The inclusion of projections herein should not be regarded as a representation or guarantee regarding the reliability, accuracy or completeness of the information contained herein, and neither FS Investments nor the author are under any obligation to update or keep current such information.

All investing is subject to risk, including the possible loss of the money you invest.

Search our site