Chart of the week

Small cap stocks confront growing quality issues

70% of Russell 2000 companies that have IPO’d since 2020 have negative earnings, highlighting the challenges facing public small cap markets.

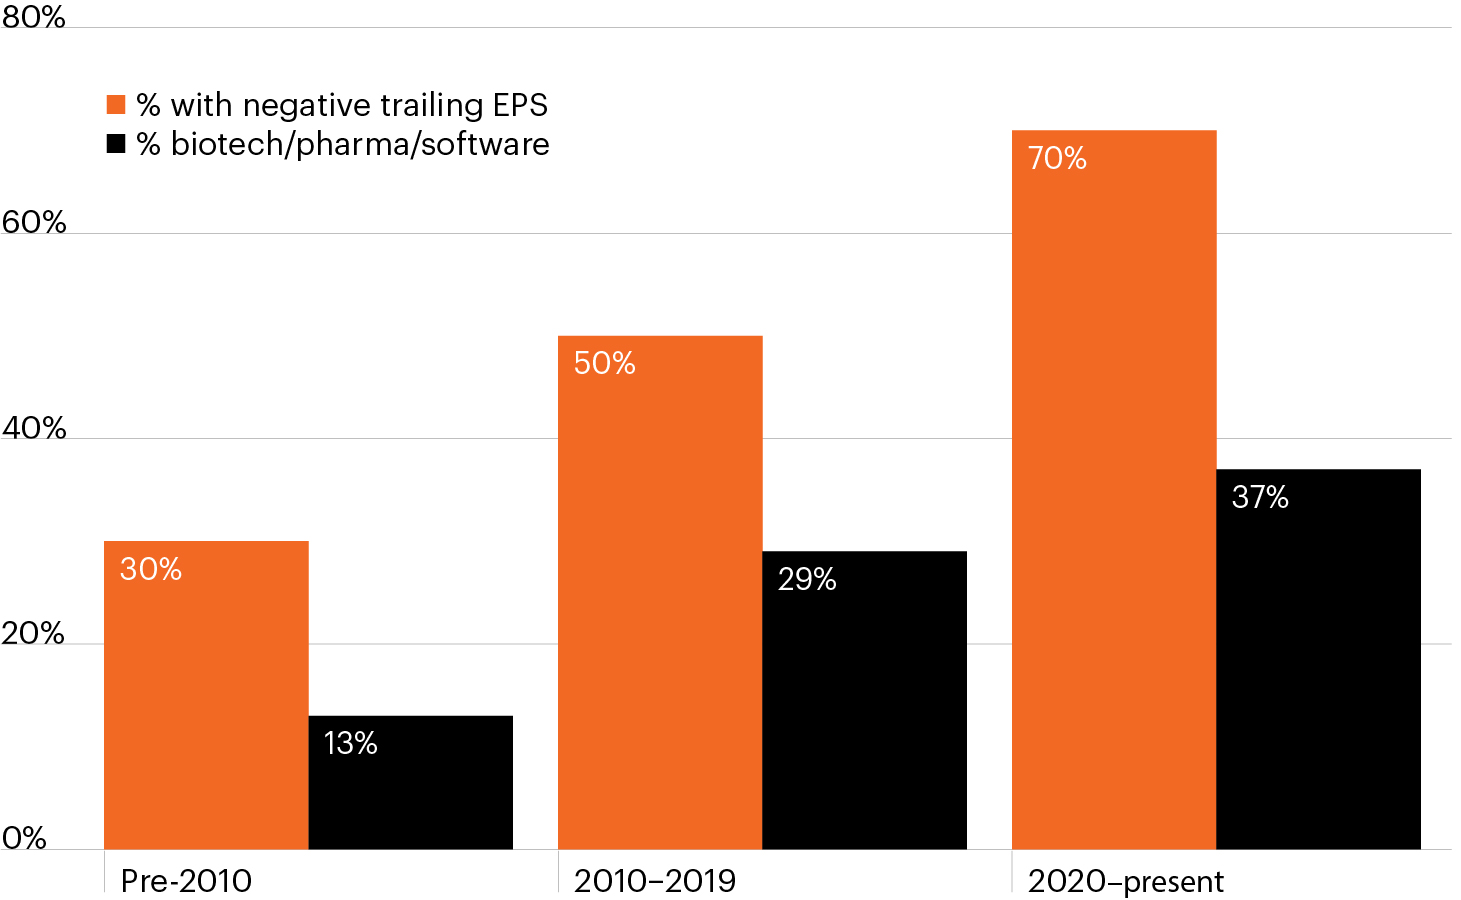
Composition of Russell 2000 members by IPO date

Column chart showing the composition of Russell 2000 members by IPO date. 30% of companies with an IPO before 2010 had negative trailing earnings per share (EPS). That figure has since risen dramatically to 50% between 2010-2019 and 70% since 2020. The change has been driven by deteriorating quality of publicly listed small cap companies as higher-quality companies have chosen to stay private for longer as well as the increasing representation of traditionally speculative sectors (like the biotech, pharma and software industries) whose bottom lines are less linked to U.S. economic conditions.

Source: Bloomberg Finance, L.P., FS Investments, as of February 28, 2025.

  • Risk assets started the year facing significant volatility, punctuated recently by rising geopolitical tension and trade uncertainty. Amid the market’s broad-based declines, small cap stocks have suffered the greatest losses, down -8.9% compared to -4.6% for the S&P 500.1
  • Small cap stocks entered 2025 with significant challenges. Nearly half (43%) of Russell 2000 companies produced negative earnings as of December 2024, up from just 14% in 1994, as the quality of companies that comprise the Rusell 2000 Index has meaningfully deteriorated.2
  • As the chart shows, while a moderate 30% of companies with an IPO before 2010 had negative trailing earnings per share (EPS), that figure has since risen dramatically.2 Of the nearly 500 companies that have IPO’d since 2020, 70% have negative trailing EPS.2
  • The Index’s deteriorating quality is driven both by higher-quality companies choosing to stay private for longer and the increasing representation of speculative sectors (biotech/pharma/software) whose bottom lines are less linked to U.S. economic conditions.
  • Private middle market companies, where revenue and employment trends are more closely linked to those of the broader U.S. economy, may represent an appealing antidote to the lower-quality stocks that comprise the Russell 2000 Index.

  • As of March 12, 2025. Small cap stocks represented by the Russell 2000 Index.

  • Bloomberg Finance, L.P.

The chart of the week and any accompanying data is for informational purposes only and shall not be considered an investment recommendation or promotion of FS Investments or any FS Investments fund. The chart of the week is subject to change at any time based on market or other conditions, and FS Investments and FS Investment Solutions, LLC disclaim any responsibility to update such market commentary. The chart of the week should not be relied on as investment advice, and because investment decisions for the FS Investments funds are based on numerous factors, may not be relied on as an indication of the investment intent of any FS Investments fund. None of FS Investments, its funds, FS Investment Solutions, LLC or their respective affiliates can be held responsible for any direct or incidental loss incurred as a result of any reliance on the chart of the week or other opinions expressed therein. Any discussion of past performance should not be used as an indicator of future results.

This information is educational in nature and does not constitute a financial promotion, investment advice or an inducement or incitement to participate in any product, offering or investment. FS Investments is not adopting, making a recommendation for or endorsing any investment strategy or particular security. All views, opinions and positions expressed herein are that of the author and do not necessarily reflect the views, opinions or positions of FS Investments. All opinions are subject to change without notice, and you should always obtain current information and perform due diligence before participating in any investment. FS Investments does not provide legal or tax advice and the information herein should not be considered legal or tax advice. Tax laws and regulations are complex and subject to change, which can materially impact any investment result. FS Investments cannot guarantee that the information herein is accurate, complete, or timely. FS Investments makes no warranties with regard to such information or results obtained by its use, and disclaims any liability arising out of your use of, or any tax position taken in reliance on, such information.

Any projections, forecasts and estimates contained herein are based upon certain assumptions that the author considers reasonable. Projections are necessarily speculative in nature, and it can be expected that some or all of the assumptions underlying the projections will not materialize or will vary significantly from actual results. The inclusion of projections herein should not be regarded as a representation or guarantee regarding the reliability, accuracy or completeness of the information contained herein, and neither FS Investments nor the author are under any obligation to update or keep current such information.

All investing is subject to risk, including the possible loss of the money you invest.

Search our site