Chart of the week

Volatility highlights private credit lender protections

98% of lower middle market loans issued in 2024 included a covenant compared to just 10% for syndicated loans.

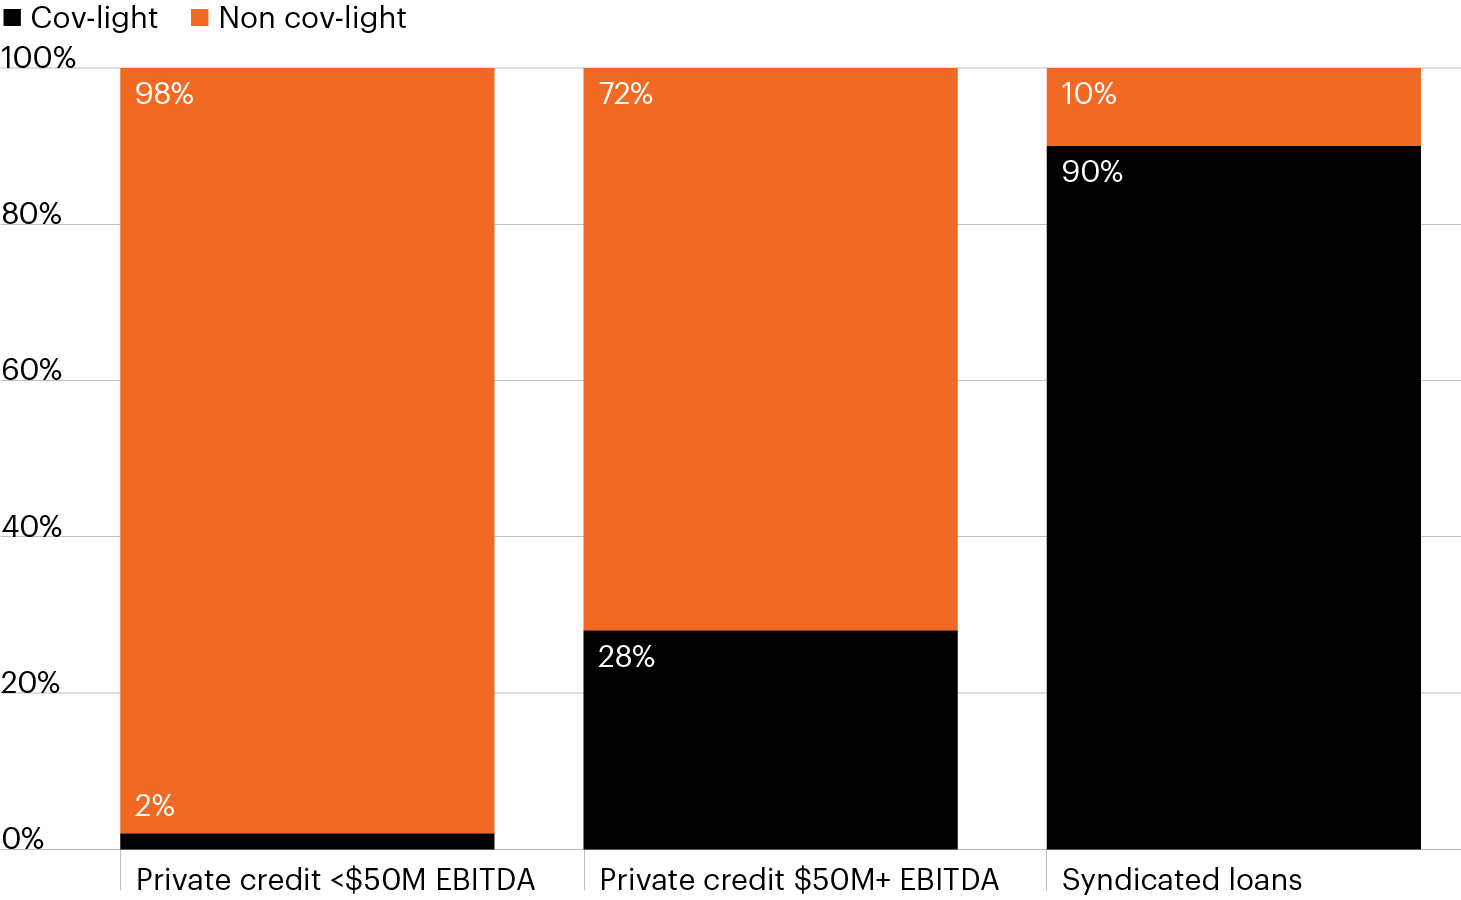
2024 new issuance volume by loan type

Column chart that divides new issuance volume in 2024 based on covenant protections. Among private loans, 72% of upper middle market loans (issuer EBITDA above $50M) included one or more covenants; 98% of lower middle market loans (issuer EBITDA of $50M or less) included a covenant compared to just 10% of syndicated loans. Issuer protections are less prevalent in the syndicated loan market, where loans are held by hundreds of investors with small tradable slices of exposure.

Source: KBRA DLD Research, as of December 31, 2024, latest data available.

  • Private credit has been a particularly attractive investment in recent years, given its healthy yield premium over similarly rated public debt. Recent volatility highlights another important potential benefit of private credit: Tighter deal terms.
  • The chart highlights the massive gap in lender protections between private and public credit markets. Just 10% of syndicated (public) loans issued in 2024 included a covenant aimed at protecting lender interests compared to 72% of upper middle market deals and nearly all (98%!) of lower middle market deals.
  • This wide disparity reflects a fundamental difference: Syndicated loans are carved up and distributed to many investors, often hundreds, and price is typically the only negotiated term. Private credit is typically held by one or a few lenders who conduct their own due diligence and underwrite the loans with the intent to hold through maturity.
  • Periods of economic or market dislocations can create attractive buying opportunities across select public credit investments as spreads widen, but volatility also highlights the importance of strong covenant protections. Private credit, particularly in the lower and core middle market, has long relied on covenants as a tool to help mitigate credit losses.

The chart of the week and any accompanying data is for informational purposes only and shall not be considered an investment recommendation or promotion of FS Investments or any FS Investments fund. The chart of the week is subject to change at any time based on market or other conditions, and FS Investments and FS Investment Solutions, LLC disclaim any responsibility to update such market commentary. The chart of the week should not be relied on as investment advice, and because investment decisions for the FS Investments funds are based on numerous factors, may not be relied on as an indication of the investment intent of any FS Investments fund. None of FS Investments, its funds, FS Investment Solutions, LLC or their respective affiliates can be held responsible for any direct or incidental loss incurred as a result of any reliance on the chart of the week or other opinions expressed therein. Any discussion of past performance should not be used as an indicator of future results.

This information is educational in nature and does not constitute a financial promotion, investment advice or an inducement or incitement to participate in any product, offering or investment. FS Investments is not adopting, making a recommendation for or endorsing any investment strategy or particular security. All views, opinions and positions expressed herein are that of the author and do not necessarily reflect the views, opinions or positions of FS Investments. All opinions are subject to change without notice, and you should always obtain current information and perform due diligence before participating in any investment. FS Investments does not provide legal or tax advice and the information herein should not be considered legal or tax advice. Tax laws and regulations are complex and subject to change, which can materially impact any investment result. FS Investments cannot guarantee that the information herein is accurate, complete, or timely. FS Investments makes no warranties with regard to such information or results obtained by its use, and disclaims any liability arising out of your use of, or any tax position taken in reliance on, such information.

Any projections, forecasts and estimates contained herein are based upon certain assumptions that the author considers reasonable. Projections are necessarily speculative in nature, and it can be expected that some or all of the assumptions underlying the projections will not materialize or will vary significantly from actual results. The inclusion of projections herein should not be regarded as a representation or guarantee regarding the reliability, accuracy or completeness of the information contained herein, and neither FS Investments nor the author are under any obligation to update or keep current such information.

All investing is subject to risk, including the possible loss of the money you invest.

Search our site