The equity market has had a volatile few months, and big selloffs and heightened volatility are being tied directly to signs the economy is slowing. But the challenges facing the equity market are sharply different from the downshift taking place in the economy. We look at what is eroding lofty equity market valuations, what to expect at the upcoming Fed meeting, and why market volatility may be more noise than signal about the economy. It is critical to understand that publicly traded markets have drifted far from the underlying dynamics of the economy, and investors may need to look outside the S&P 500 for more direct exposure to U.S. economic strength.
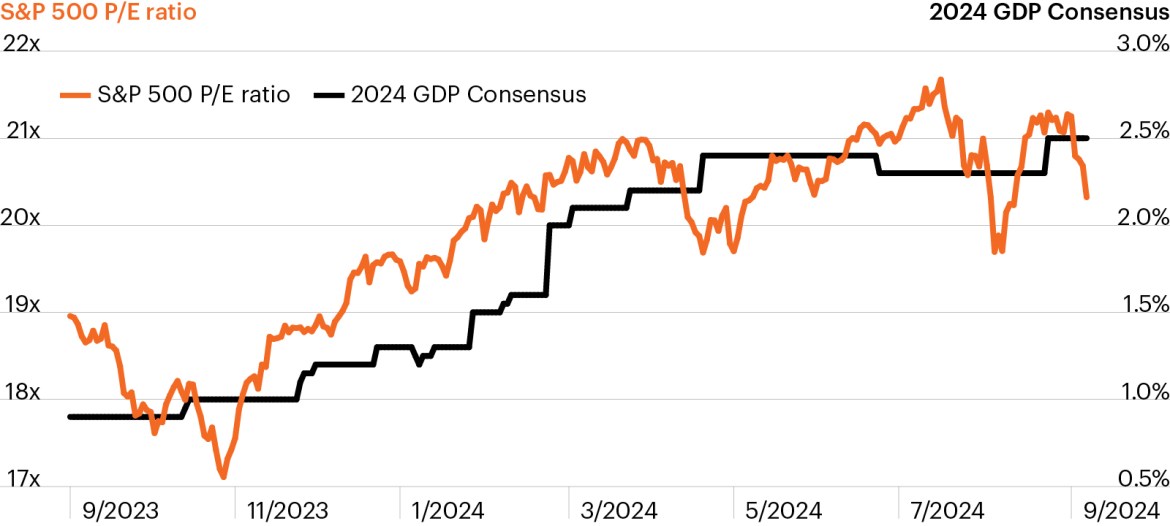
Investor jitters do not reflect a healthy, but slowing, U.S. economy. At the end of July, markets found themselves at all-time highs with expensive P/E valuations to match. This was the culmination of three powerful supports driving upbeat performance to varying degrees for the past six quarters: Better-than-expected economic data, the prospect of Fed rate cuts, and the hope that AI would soon lead to outsized profitability. Today, those favorable supports are shaky
Economic optimism helped power valuations

Source: Bloomberg Finance, L.P., as of September 6, 2024.
The top theme of my Q3 macro outlook was the ironic problem of overly optimistic economic expectations. When so much good news is priced in, markets can be rocked by any downside surprise in growth, even an incremental slowdown to a more sustainable path. In early August, the wall of positive data started to crack, most notably in the labor market as a softening in hiring began at the start of Q2, earlier than previously understood. The economic news is not all bad, by any stretch. Recent consumption data has remained upbeat, and data so far points to real GDP growth of 2.5% q/q in Q31, hardly a hard landing. Yet this is the challenge markets almost inevitably face when expectations were set to maximum optimism. Yet this is the challenge markets almost inevitably face when expectations were set to maximum optimism.
The second support is the promise of easier monetary policy. In Q4 2023, it was clear the Fed rate hike cycle was over and the Fed pivot towards possible rate cuts had markets exuberantly pricing lower rates. But it matters why the Fed is cutting rates. More often than not, rate cuts are aggressive because a recession is unfolding—not a good market outcome. Against the backdrop of stronger than expected growth, however, rate cuts were an added bonus. Today, as the data are delivering a more mixed picture for growth, suddenly the Fed feels behind the curve. Policy uncertainty has ratcheted higher. I’ll dig deeper into the September 18 FOMC meeting shortly.
Finally, the third support has become fragile. AI has played an important role in the market rally for some time, but its relevance has been especially elevated over the last 7 quarters, as hopes for outsized productivity and profitability kept tech company valuations moving higher, arguably past the point of positive fundamental economic drivers. But the Q2 earnings season highlighted chip production snags and raised questions around the monetizable use cases for AI. Capital expenditures are good for GDP growth, and investment today often leads to productivity gains in the future (good news for the economy in the long run). But equity markets see investment as detracting from free cash flow, and with near-term profitability coming under greater scrutiny, the cost-benefit analysis seems to be shifting.
Separately, each of these three supports for markets over the past one to two years has started to erode. Together, it adds up to increased sensitivity to data releases and the potential for higher volatility in both bond and equity markets. Hopes that the first rate cut on September 18 will provide clarity and calm markets may be misplaced.
Inflation has cooled, it’s time for rate cuts: The August CPI confirmed the disinflationary downtrend is back in place. Consumer prices rose 0.2% m/m, bringing inflation down to 2.5% y/y, the lowest since March 2021. Excluding food and energy, prices rose 0.3% m/m, a tad more than expected as stubborn rent inflation contributed to a slight upside surprise and held core inflation at 3.2% y/y. Nevertheless, lower headline inflation is the green light to adjust rates lower.
The unexpected rise in the unemployment rate has made the matter more urgent. While the Fed has held the nominal policy rate steady since July 2023, the real Fed funds rate (adjusted for core CPI inflation) has risen from 0.68% to 2.22% in August. This year has seen an extraordinary swing in Fed rate expectations, from markets looking for seven rate cuts at the start of the year, to almost entirely pricing out a rate cut, to today expecting 100 bps of rate cuts over three meetings and almost 150 bps of rate cuts through January 2025.
I expect this uncertainty around Fed policy to remain in place well after the September 18 FOMC meeting. I expect a quarter point rate cut, but it is a close call and markets have been toggling between -25 bps and -50 bps for weeks. At the time of writing, markets still place 15% odds of a larger half point cut. The Fed will likely include dovish language that they are ready to do more should the labor market deteriorate further, leaving their options open for more aggressive rate cuts should they be needed. In short, expect highly data dependent, rapidly shifting policy expectations to dominate markets for some time. August delivered a painful example of the volatility caused by this spike in policy uncertainty. The VIX surged to 60 on August 5 as a sharp sell-off that was triggered by the July jobs report saw a 43 bps move down in the December Fed funds future rate. Markets have since recovered, but the VIX is still above July levels. The election will likely only add to volatility in both the equity and bond markets, which historically experience higher volatility in the two months prior.
The stock market is not the economy. I often start my presentations with a graphic showing a person flying a kite. The person represents the economy, grounded and maybe one step forward or one step back. This is in juxtaposition to the kite, which is financial markets. Yes, the kite is absolutely connected to the person on the hill, but financial markets (like the kite) are also subject to many crosscurrents that shift rapidly and often have nothing to do with the economy (holding the string).
Never has this distinction been more important, because this is where the grounding of what drives the economy becomes critical versus the crosscurrents and challenges impacting markets and driving volatility. The publicly traded stock market is only around 3,400 firms2, and the S&P 500 is made up of only … 500. The $28 trillion U.S. economy consists of 33 million firms—the vast majority of these are single proprietorship or 1-5 employee firms. Critically, there are 200,000 privately-owned middle market firms that contribute a third of U.S. economic growth. Indeed, the outsized position of the S&P 500 in portfolios needs to be re-examined as it drifts further and further from the U.S. economy.
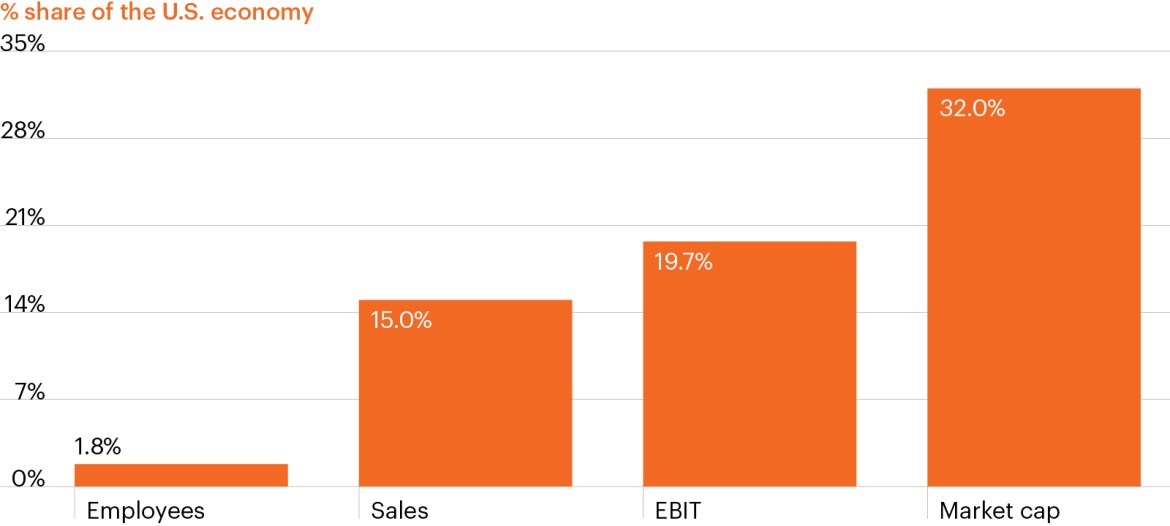
Top 10 U.S. publicly traded firms

Source: Bureau of Economic Analyis, Bureau of Labor Statistics, Bloomberg Finance, Flow of Funds, L.P., FS Investments, as of Septmber 9, 2024. Top 10 companies by market capitalization are AAPL, MSFT, NVDA, AMZN, META, GOOGL, BRK/B, LLY, AVGO, JPM.
The top 10 largest publicly traded companies account for 32% of the market cap of all public and privately traded non-financial companies, but less than 20% of profits. These 10 companies are closer to 40% of the S&P 500. Yet these companies account for less than 2% of total U.S. employment, compared to the middle market which employs about one-third, or over 50 million people.
Another key difference between the stock market and the economy is exposure to global economic conditions and geopolitics. The S&P 500 is, for all intents and purposes, a global index of large international tech companies that earn 40% of their revenue from abroad. This exposes these companies to lackluster ex-U.S. global growth (China’s economy is outright weak). The U.S. economy, by contrast, gets only 13% of its GDP from abroad in the form of imports and exports. The U.S. economy is largely food and energy independent. As a system, it is more insulated from the global economy.
The S&P 500 also has a concentration problem that has only gotten worse. Nvidia makes up 5.8% of the overall market cap, and the Magnificent 7 make up 31% of the index. This is the most concentrated the S&P 500 has been in 50 years (or ever?). Good performance masked the problem on the way up, but the downside of concentration became painfully clear during the selloff from mid-July through early August when well over half of the index move was due to these seven firms. On September 3, Nvidia fell -9.5% in one day on the back of no fundamental news, erasing $279 billion in market cap and driving 30% of the 2.1% drop in the S&P 500 by itself. Underneath this wild ride, the economy has kept on growing.
Our outlook is for an incremental slowdown to 2.0% GDP growth in Q4 and 1.75% in the first half of next year. A recession is not our base case, although I am more concerned about it today in light of the quickening increase in the unemployment rate. There is still a meaningful tailwind from government spending, which will likely continue into year-end. Business investment has grown for 12 straight quarters after years of under-investment, and there are secular reasons for this to continue. Fed rate cuts will rekindle activity in the exact sectors where rate hikes hit the hardest, namely residential construction and the housing market. Buying and selling existing homes—the majority of home purchases—do not add to GDP directly but are the catalyst for home renovation and furniture purchases, while refinancing and HELOCs can unlock spending power trapped in home equity. These are key areas of consumption that have lagged as the housing market has struggled. Households and companies are not overly leveraged this business cycle. Finally, the economy naturally grows—as a combination of labor force growth and productivity growth. At the end of the day, it usually takes an exogenous shock to move from growth to contraction. Weaker growth, in and of itself, does not automatically trigger a recession.
Conclusion: As the Fed gears up to cut rates, markets are still pricing sharply different economic outcomes. Market expectations of aggressive Fed rate cuts would imply a recession, but earnings estimates continue to look for double-digit growth in 2025 and 2026—an outcome consistent with robust growth. Heightened volatility since August would suggest a growing discomfort with this inconsistency, and Fed policy uncertainty is adding to the jitters as every data release is put under the microscope. And yet, so far the economic data point to an incremental slowdown to a path that is more sustainable. Investors should be cautious not to mistake the decay in S&P 500 valuations for outright economic weakness. The characteristics of the equity market have drifted far from the underlying U.S. economy, where there are a broad range of investment strategies that mirror solid U.S. economic growth and stability.


