In the interest of providing you with some short but sweet holiday reading, this strategy note will focus on middle market private equity. We will follow up in a few weeks with more on private credit, private real estate lending and liquid multi-strategy funds.
The impacts of the election
Regardless of your political views, we just completed a fairly impactful election that will have varying effects on the world, the U.S. economy, capital markets and alternative investment strategies.
There has been much written and discussed concerning the broader impacts of potential policy continuation (an extension of the Tax Cuts and Jobs Act), policy change (a lighter touch on regulation), potentially more sustained inflation for longer (as a result of more nearshoring and onshoring/tariff utilization), higher interest rates for longer (in the event that the U.S. budget deficit outlook deteriorates further), blah, blah, blah.
So, for this strategy note, we’re going to rapidly pivot to the impacts we are already seeing in various alternative investment strategies and expect to continue in the near term to medium term.
What does it mean for U.S. equity markets?
Let’s get started with the epitome of growth at a reasonable price (GARP): Middle market private equity.
Remember, the entire point of investing in the equity part of the capital structure in corporations, real estate or infrastructure/real assets is for growth. To achieve growth in enterprise value, earnings, net operating income, etc., you need to achieve revenue growth. So, let’s see how different sections of U.S. equity markets (I’ll constrain my comments to the U.S.) have been stacking up recently.
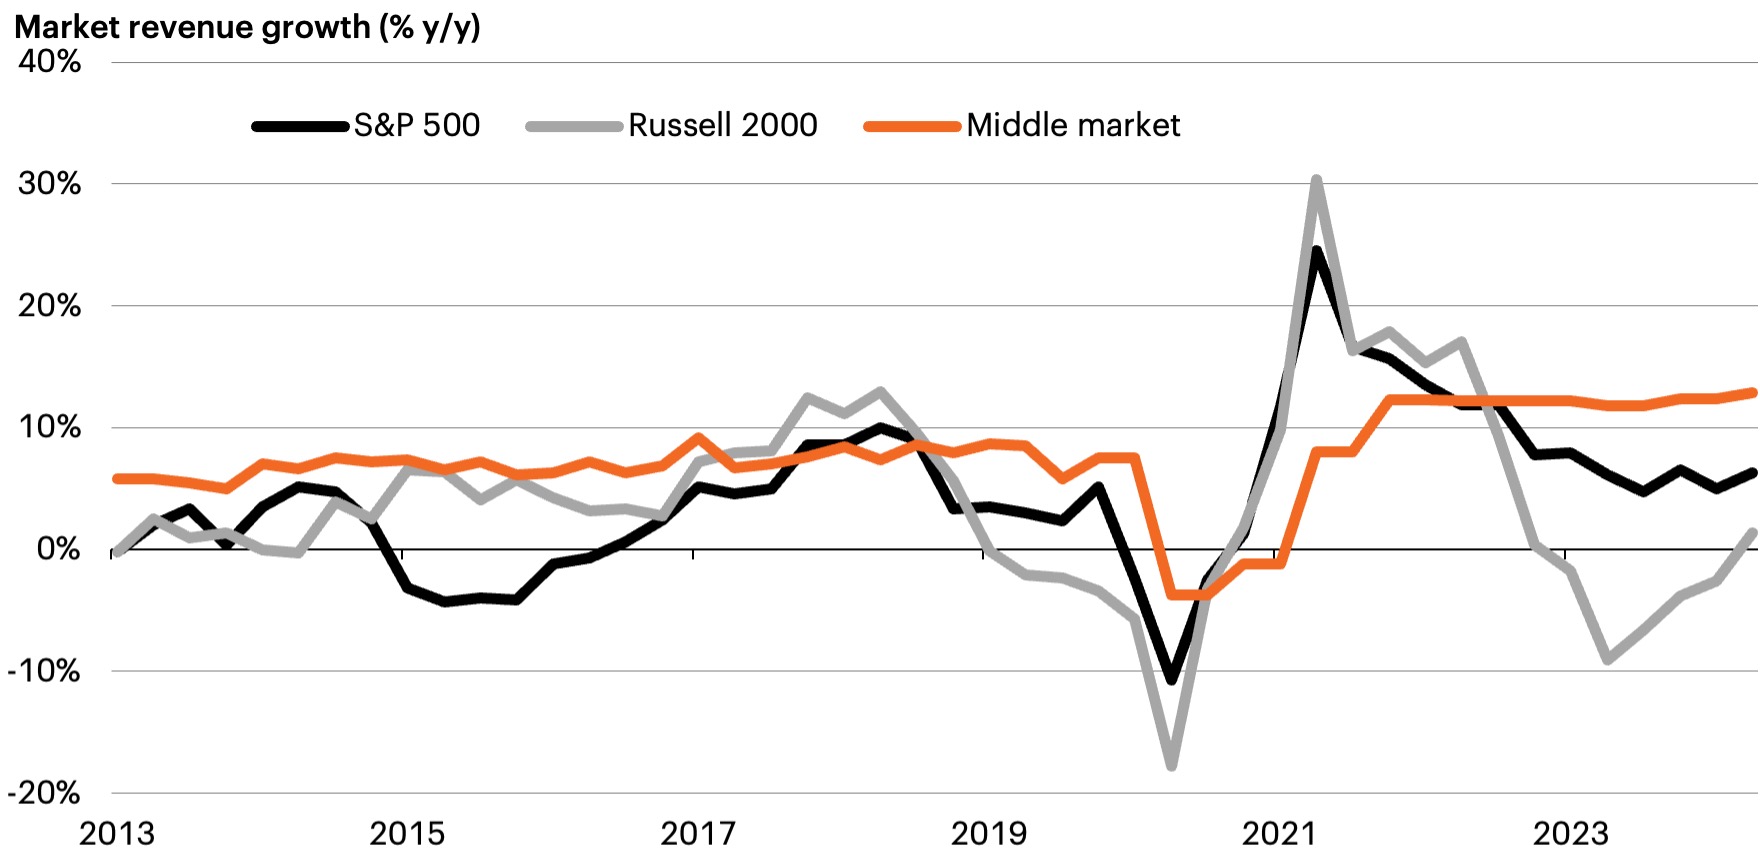
As you can see from the following chart, it looks like there has been:
- Very little if any growth in listed small cap equities (the Russell 2000 is the ultimate adverse selection bias index).
- Reasonable nominal GDP like growth in the S&P 500 (thank goodness for U.S. secular tech growth).
- Rather remarkably strong revenue growth for privately held U.S. middle market corporations.
Revenue growth for Russell 2000, S&P 500 and U.S. middle market

Source: Bloomberg Finance, L.P. Data for U.S. middle market as of June 30, 2024, latest data available. S&P 500 and Russell 2000 constituent index data as of September 30, 2024. Russell 2000 constituent index excludes financials and companies with less than $25mm EBITDA. The constituent population totals 792 companies.
Lest one believe this is just a recent phenomenon, you can see from this next chart that revenue growth outperformance of the U.S. middle market relative to the S&P 500 and the Russell 2000 has been fairly consistent over time.
Greater opportunity for growth in the middle market
Source: National Center for the Middle Market, Bloomberg Finance L.P., as of June 30, 2024.
Middle market private equity: The opportunity for growth
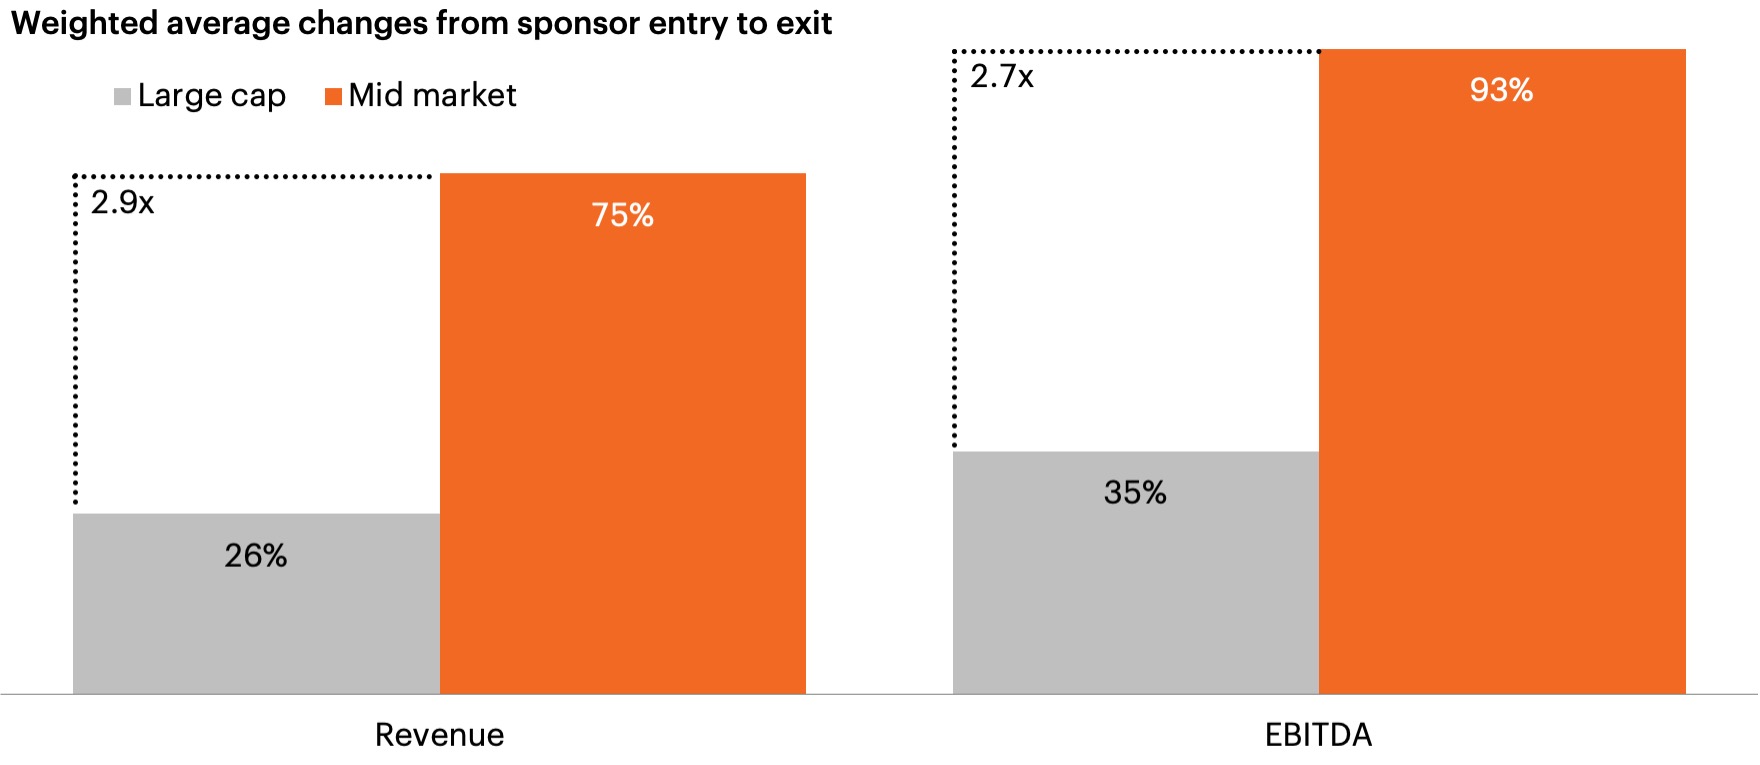
As a subtle reminder that one has to be more discerning in selecting alternative strategies to embrace these days, historically, middle market revenue and EBITDA growth have trounced large and mega cap private equity quite handily over time.
Revenue and EBITDA growth: Large cap vs. middle market
Source: MSIM database of transaction level information, including only U.S. deals and excluding Morgan Stanley transactions. Represents a sample of portfolio companies that report on EV, Revenue, EBITDA, Net Debt, Public/ Private Company, with data as of June 30, 2023; MSIM analysis as of September 2023.1
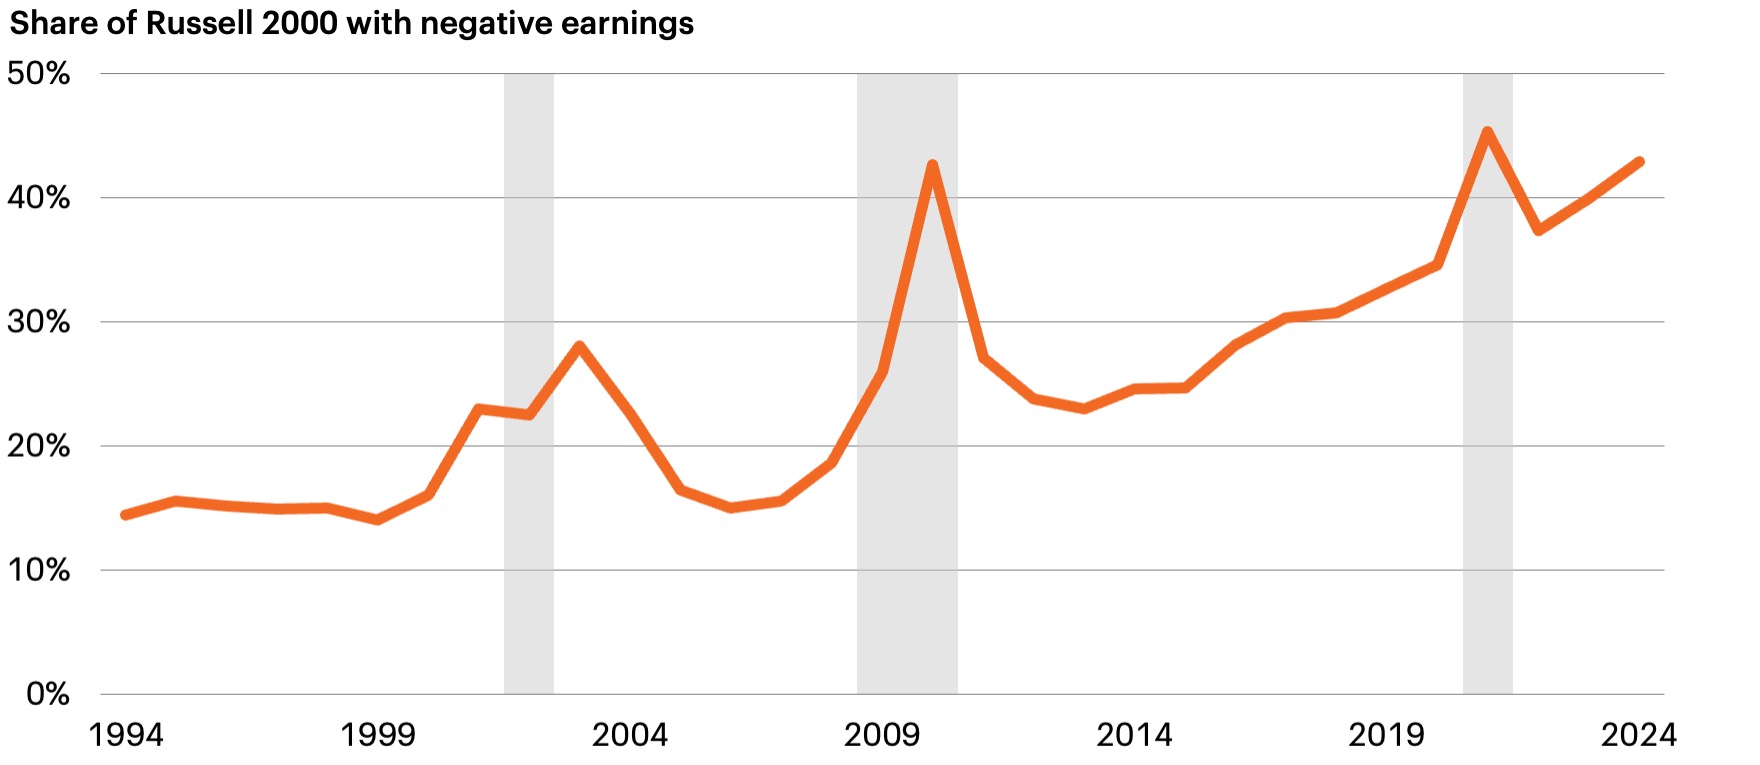
Apologies in advance, I’m really not trying to pick on the Russell 2000 here, but as you can see in the chart below, over 40% of the companies in the index can’t make money during a stable and robust economic expansion of roughly 5% nominal GDP growth.
Hence the term adverse selection bias index!
Negative earnings in Russell 2000 companies
Source: Bloomberg Finance, L.P. Russell 2000 Index. Data as of 3Q 2024. Shaded areas indicate National Bureau of Economic Research (NBER)-declared U.S. recessions.
So, I think we’ve demonstrated that, if you want growth (assuming you are no longer buying into the disastrous post-Lost-Decade investment consensus on emerging markets with their unimpressive economic growth in many cases and, even where you have had strong economic growth it has not necessarily led to investment performance…here’s looking at you China…plus actually making money from investing is sort of important), U.S. middle markets are the place to be!
“…at a reasonable price”
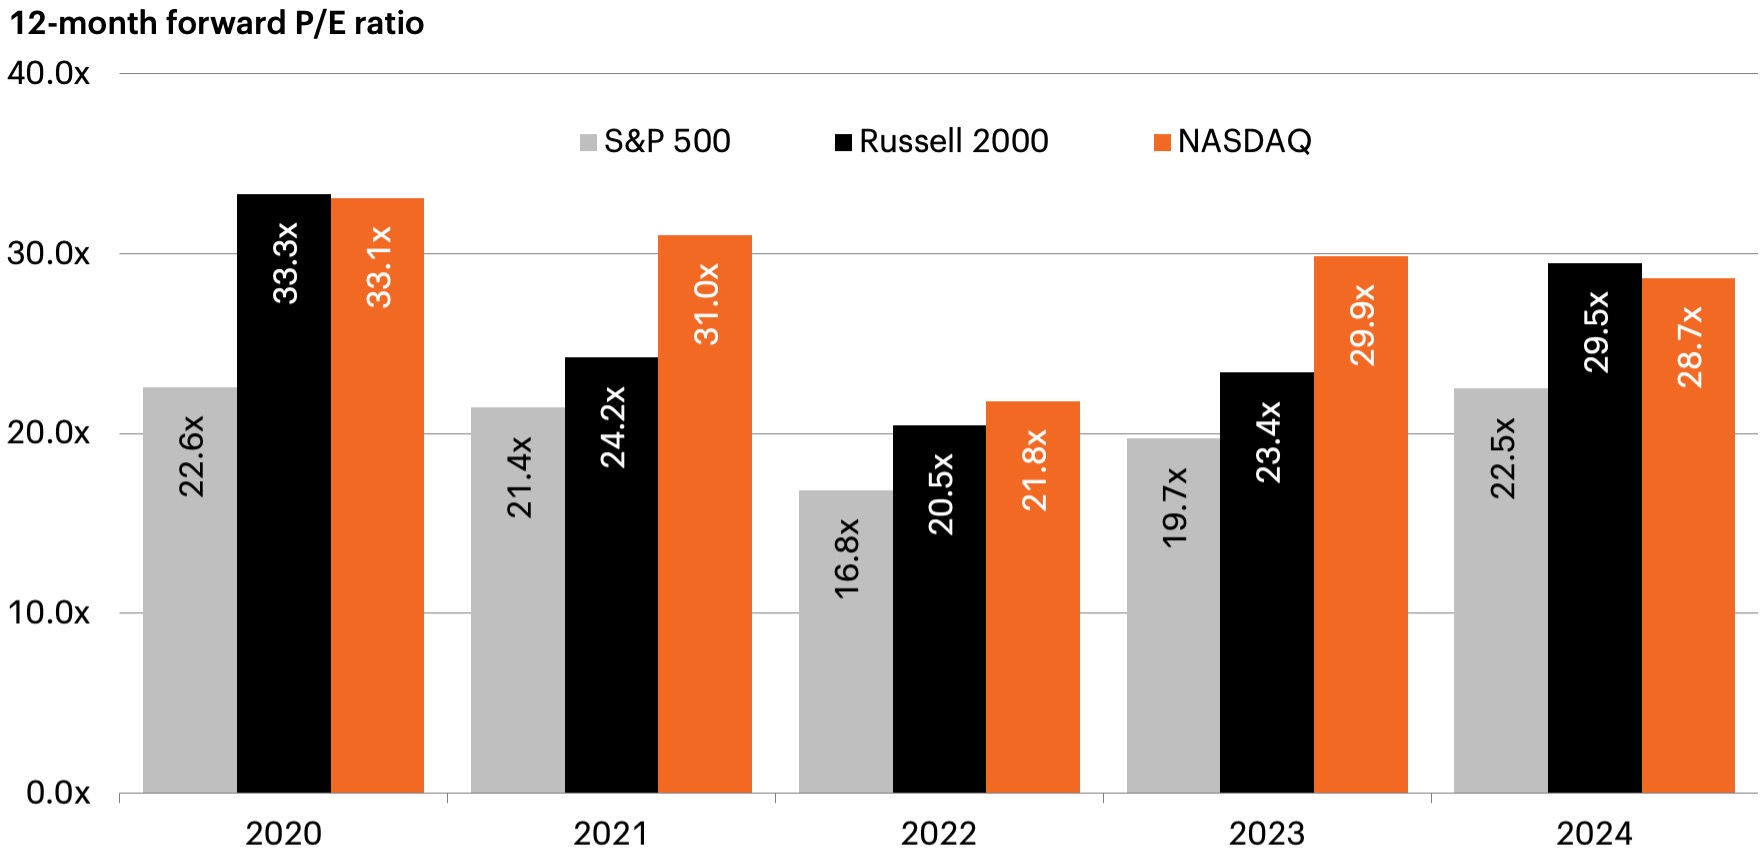
Turning our attention to “reasonable price,” as you can see from the chart below, public equity markets are, for the most part, back to trading at either unreasonable prices or at least highly elevated ones. The S&P 500 is at 23.1X forward earnings which is 9% more expensive than the end in 2021 (forgive the chart, it’s a little dated already); the Nasdaq is at 28.7X (this may be surprising to all mega cap tech haters out there, but the index is actually 7.4% cheaper than in 2021); and the Russell 2000 is at a staggering 29.5X forward earnings (21.9% more expensive than in 2021).
Valuations in public markets
Source: Bloomberg Finance L.P., as of November 29, 2024.
Election impact: Listed equity prices
Of course, the main impact of the election outcome so far has been on listed equity prices (rich assets getting richer), particularly in small caps.
As you can see from the chart below (and in stark contrast to the Russell 2000 and the S&P 500), private market transaction valuations are materially cheaper than in 2021 across the board by 15% or greater.
Valuations in private equity
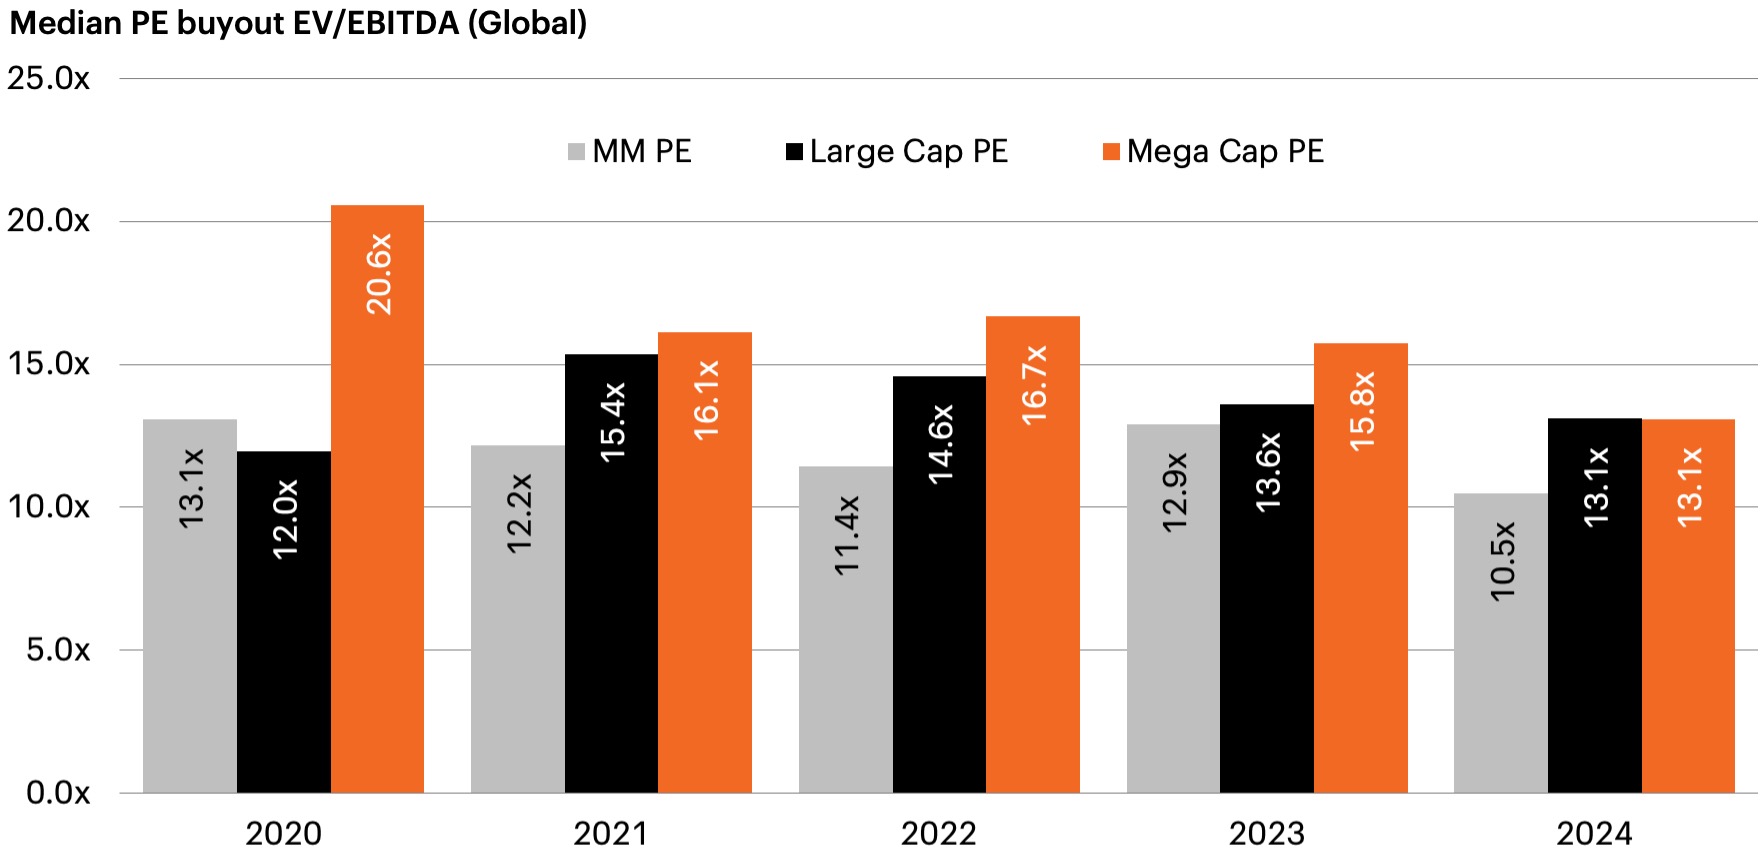
Source: Pitchbook. Data as of September 30, 2024. Middle market private equity consists of multiples on deals between $500 million and $1 billion. Large cap private equity consists of multiples on deals between $1 billion and $5 billion. Mega cap private equity consists of multiples on deals of $5 billion or more.
Furthermore, when we normalize all markets to enterprise value/EBITDA (remember, private markets are always quoted in EV/EBITDA terms and public markets are market cap value/earnings (P/E) or market cap value/free cash flow (P/FCF)), you clearly see the dramatic recent pre- and post-election expansion of EV/EBITDA of public markets vs. private market transactions.
Valuation disparity: Middle market PE vs. Russell 2000
The most dramatic example of this is that post-election, the Russell 2000 has surged to 16.8 EV/EBITDA vs. 10.1 for the private middle market.
Believe me, I get the pre- and post-election trading rationale to hop on the U.S. small cap rally because Greater Fool theory is a real thing that drives price action from time to time. However, from an asset allocation and investment standpoint, the Russell 2000 (an index where 40%+ of the companies were unprofitable from Q4 of 2022 through Q3 of 2023—and trailing 12 months (TTM) revenue growth has been less than 2%) is trading at a 60% higher valuation than U.S. middle market private equity Q3 transactions, while middle market PE has grown revenue by almost 13% from Q2 of 2022 through Q2 of 2023. OMG, talk about a valuation disparity!
Private equity valuations start to re-expand
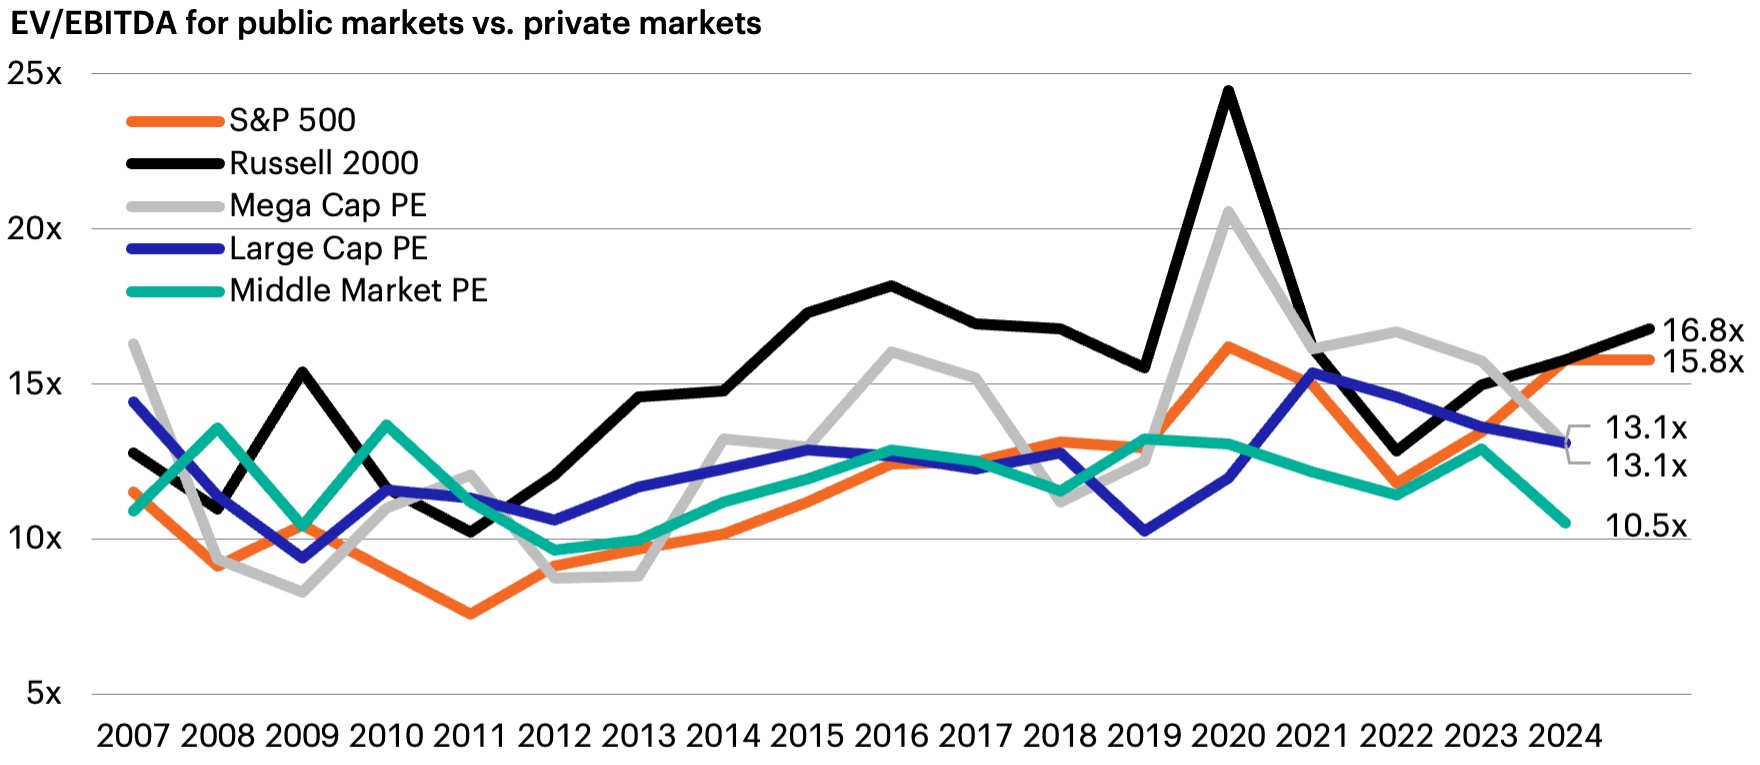
Source: Pitchbook for Mega Cap PE, Large Cap PE and Middle Market PE as of September 30, 2024; Bloomberg Finance L.P. for S&P 500 and Russell 2000 as of October 31, 2024. Middle market private equity consists of multiples on deals between $500 million and $1 billion. Large cap private equity consists of multiples on deals between $1 billion and $5 billion. Mega cap private equity consists of multiples on deals of $5 billion or more.
To make a long story short, this degree of divergence cannot hold much longer.
The most likely outcome is for private market valuations to not only stop suffering from valuation/multiple compression2 like the last almost three years, but also to start re-expanding over the next few quarters.
So, get ready to potentially have some mark-to-market unrealized gains again in your private equity portfolios (it’s been a long hangover from late 2020 and 2021). For evergreen private equity vehicles, the entry point is about as compelling as it has ever been relative to public markets.
A lull in corporate activity
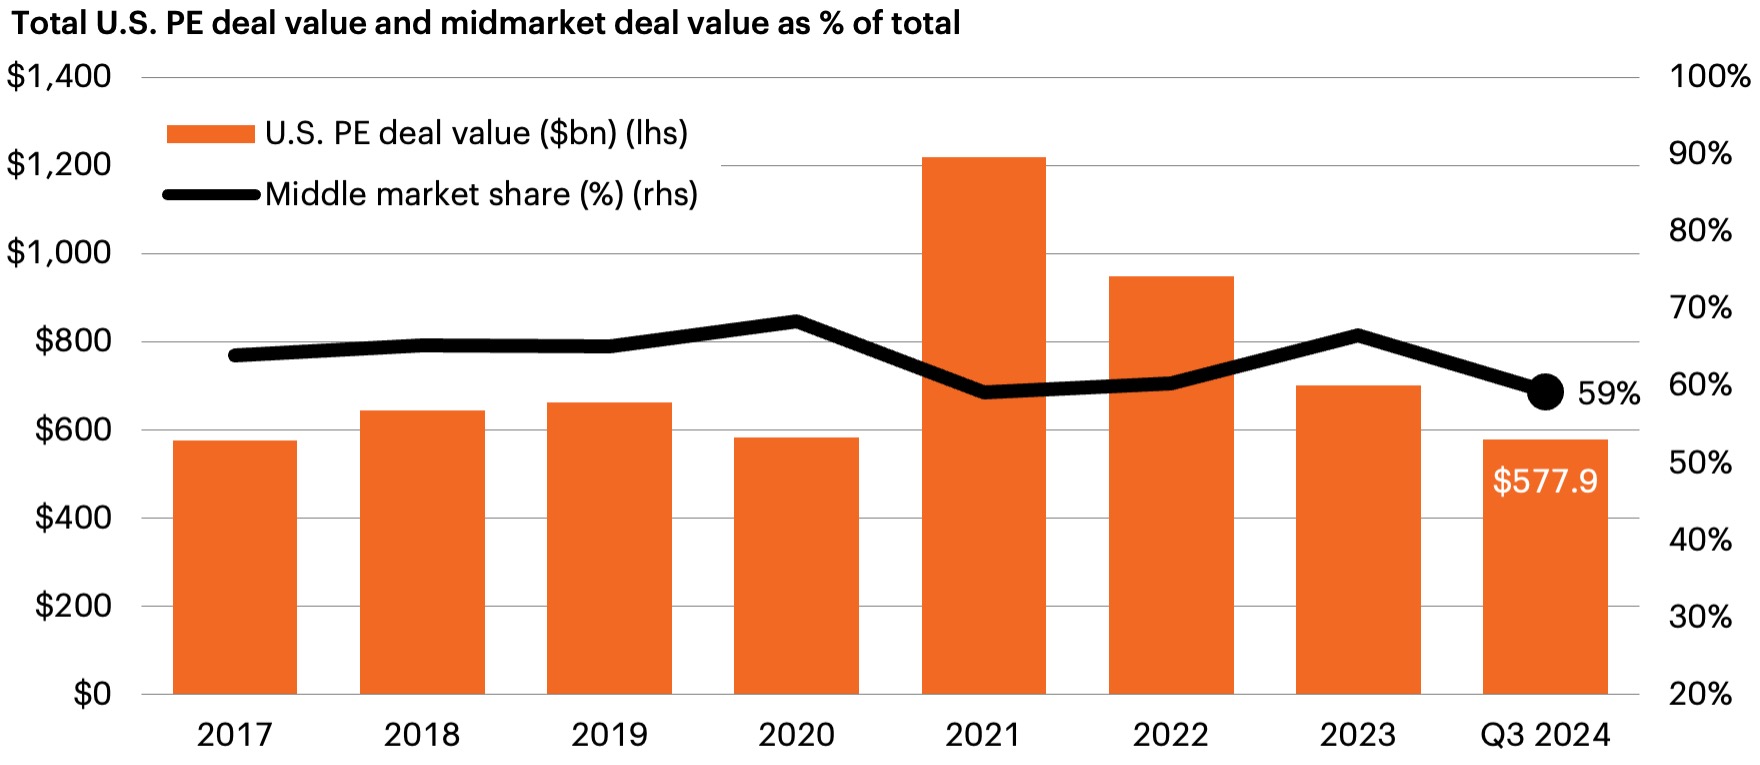
Turning our attention to corporate activity, we have had quite a lull recently in corporate activity both for 1) mergers, 2) initial public offerings and 3) private deal flow, particularly relative to the green-light-go environment of 2021, the growth in U.S. nominal GDP, the growth in public market size and the volume of capital dedicated to private markets.
U.S. M&A activity
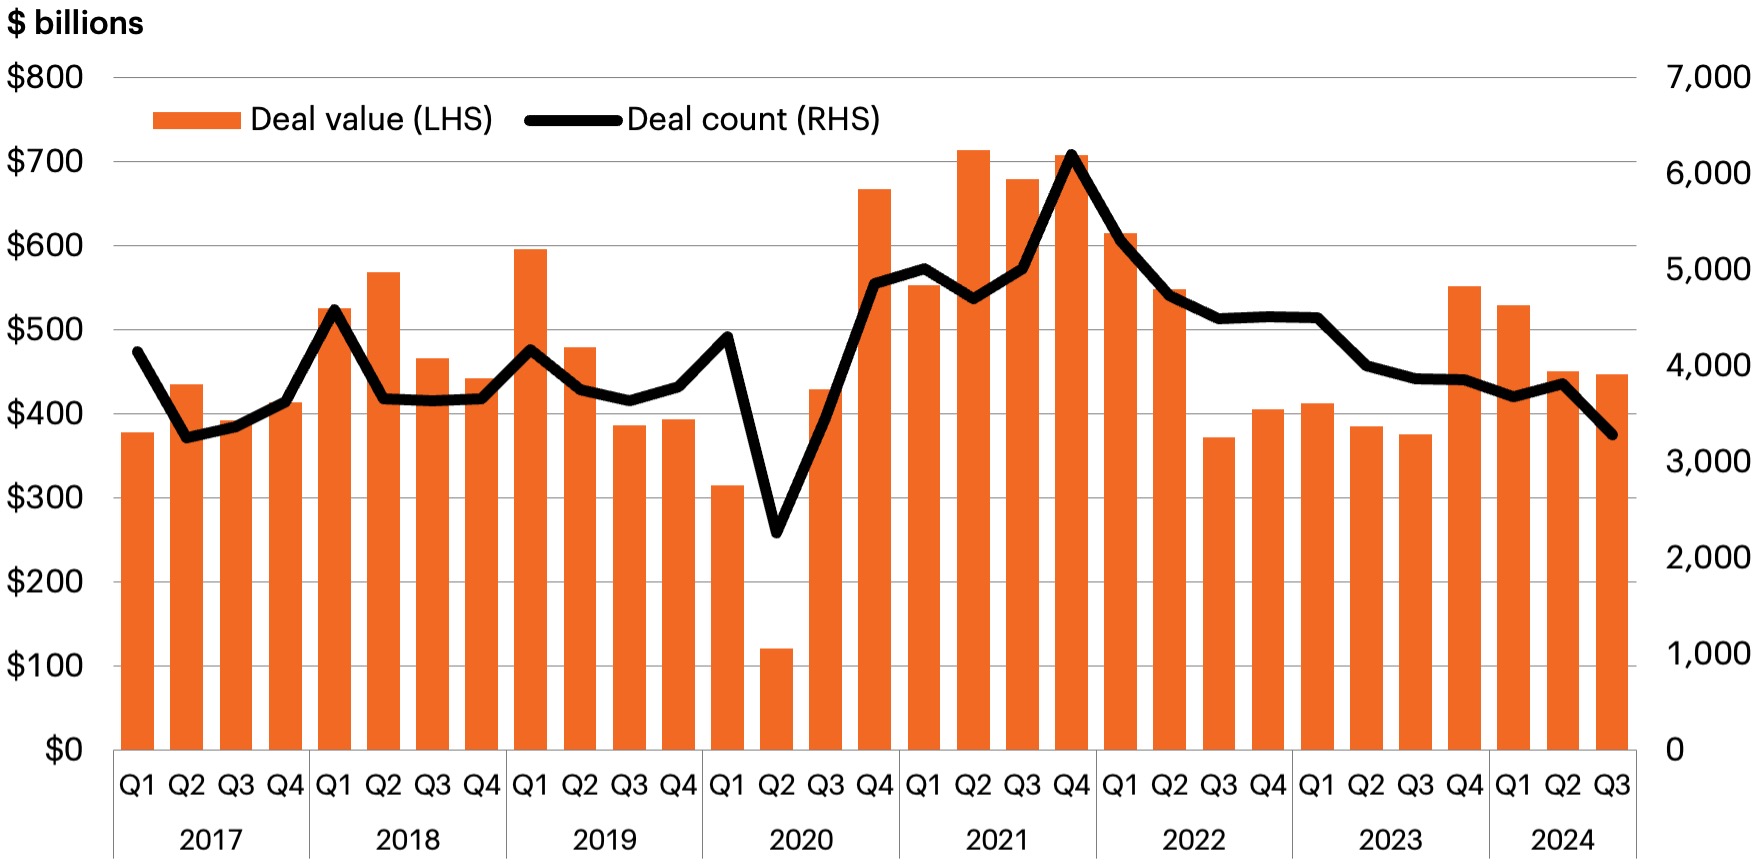
Source: Pitchbook, as of Q3 2024.
U.S. private equity IPO activity by quarter
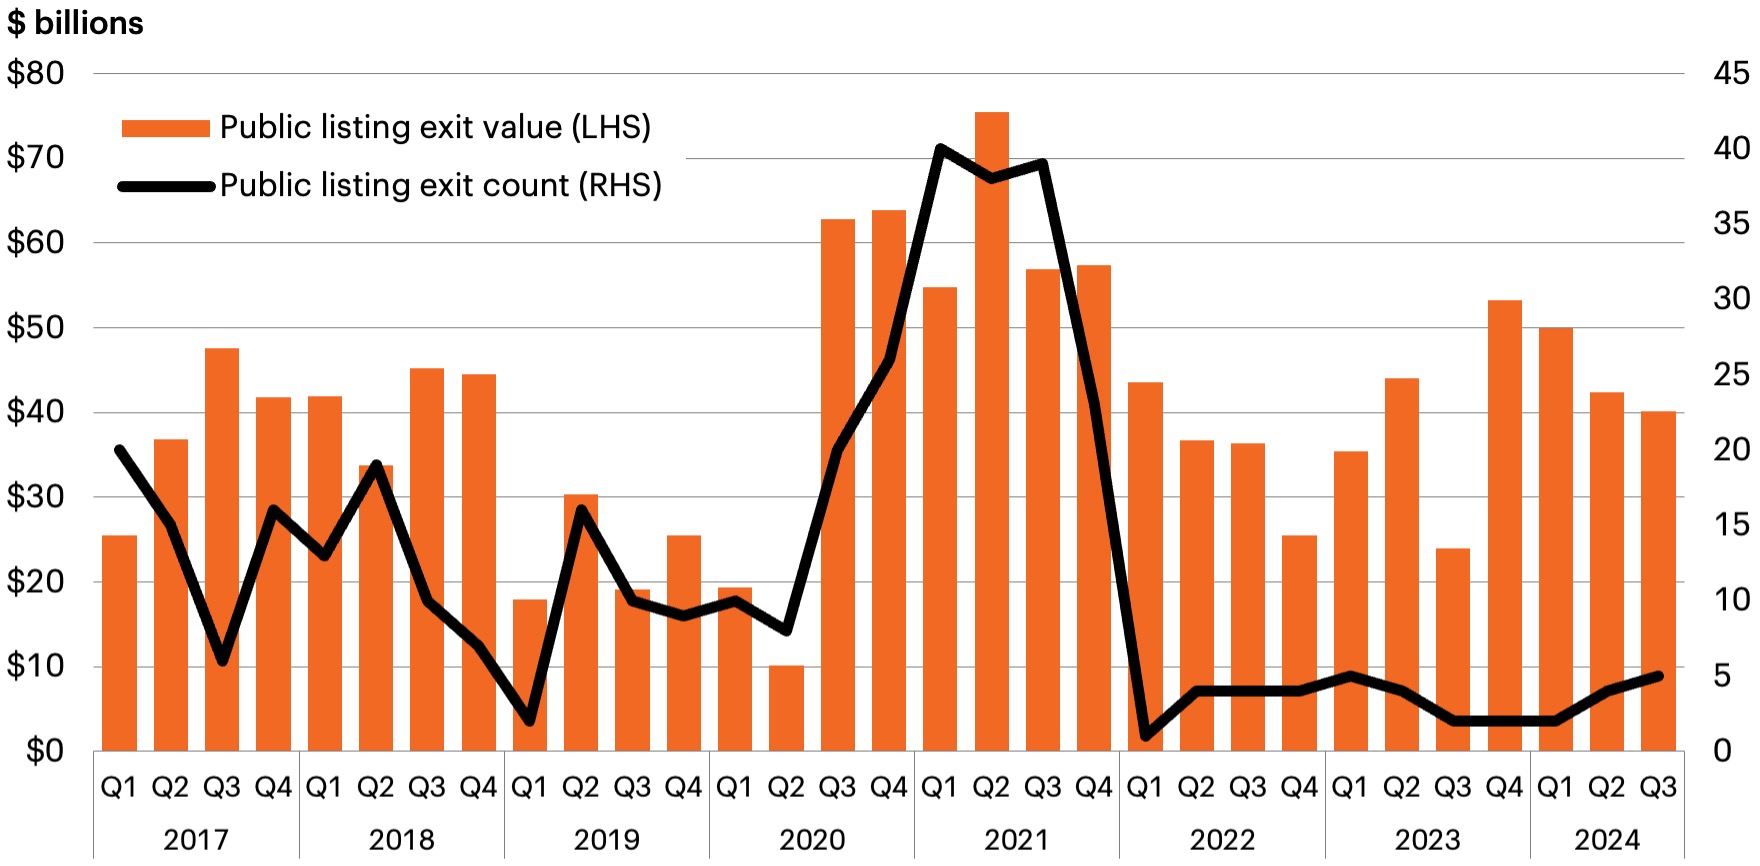
Source: Pitchbook, as of September 30, 2024.
Deals surged in 2021 but retreated the past three years
Source: Pitchbook, as of September 30, 2024.
Post-election, there is now a clear consensus that merger, acquisition, IPO and private market deal flow should expand considerably. This is due not only to a lighter touch at the Federal Trade Commission (FTC) for all transactions not associated with mega cap tech, but also less intrusive regulation for private market transactions, a more business-friendly SEC and a long-awaited rekindling of animal spirits in the IPO market.
However, we do not expect mega cap tech to be able to go back to acquisition mode any time soon—or ever for that matter (other than in China, one of the few areas these days with bipartisan consensus). Furthermore, it would be overly optimistic to expect the IPO market to approach 2021 levels in the nearer term.
How does this impact large and mega cap PE?
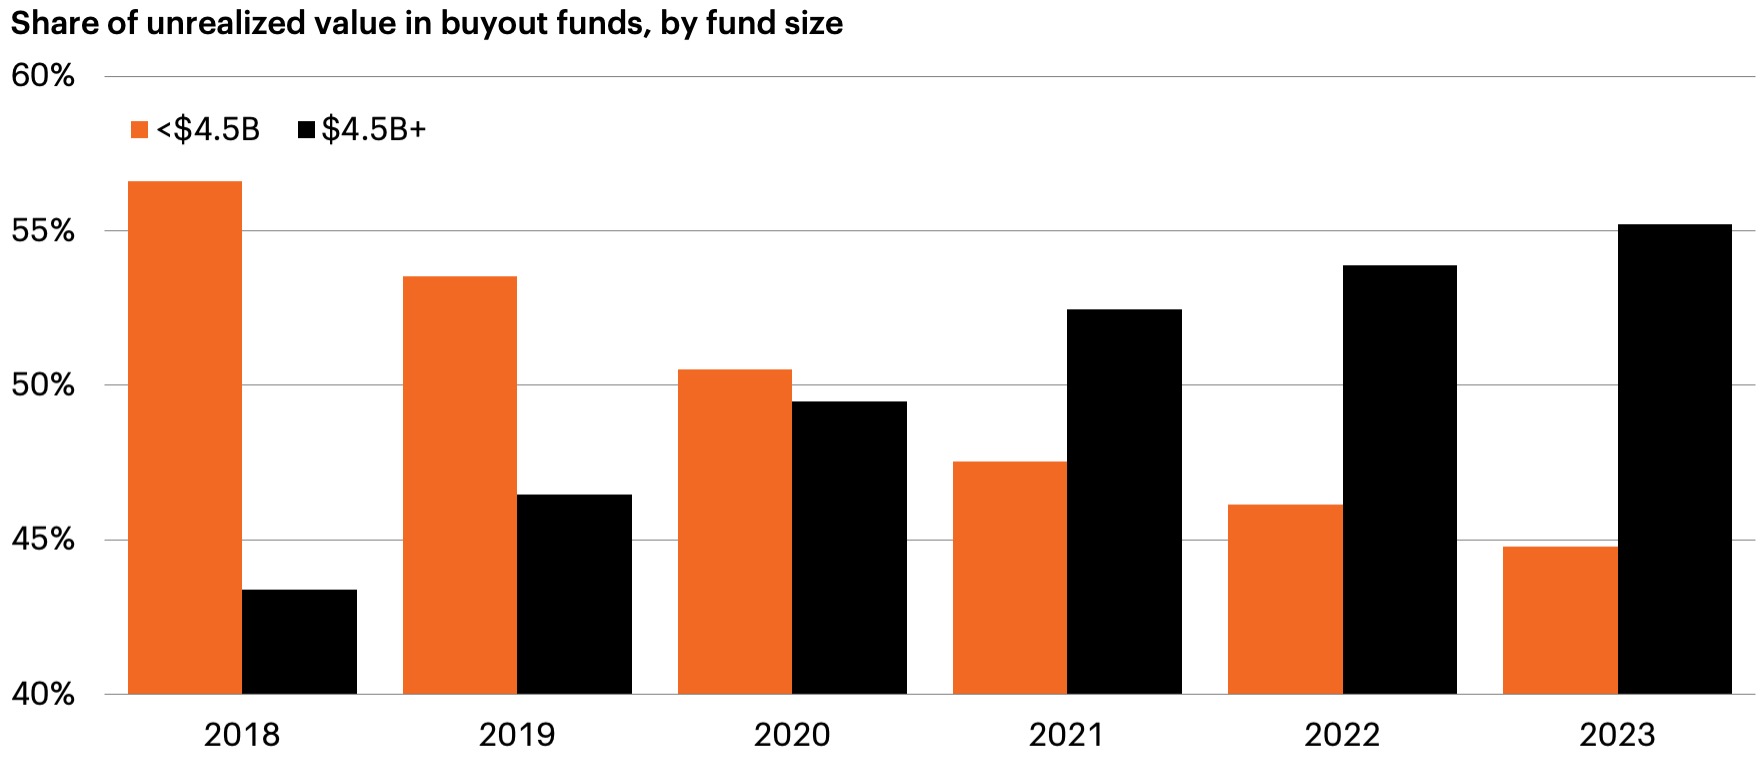
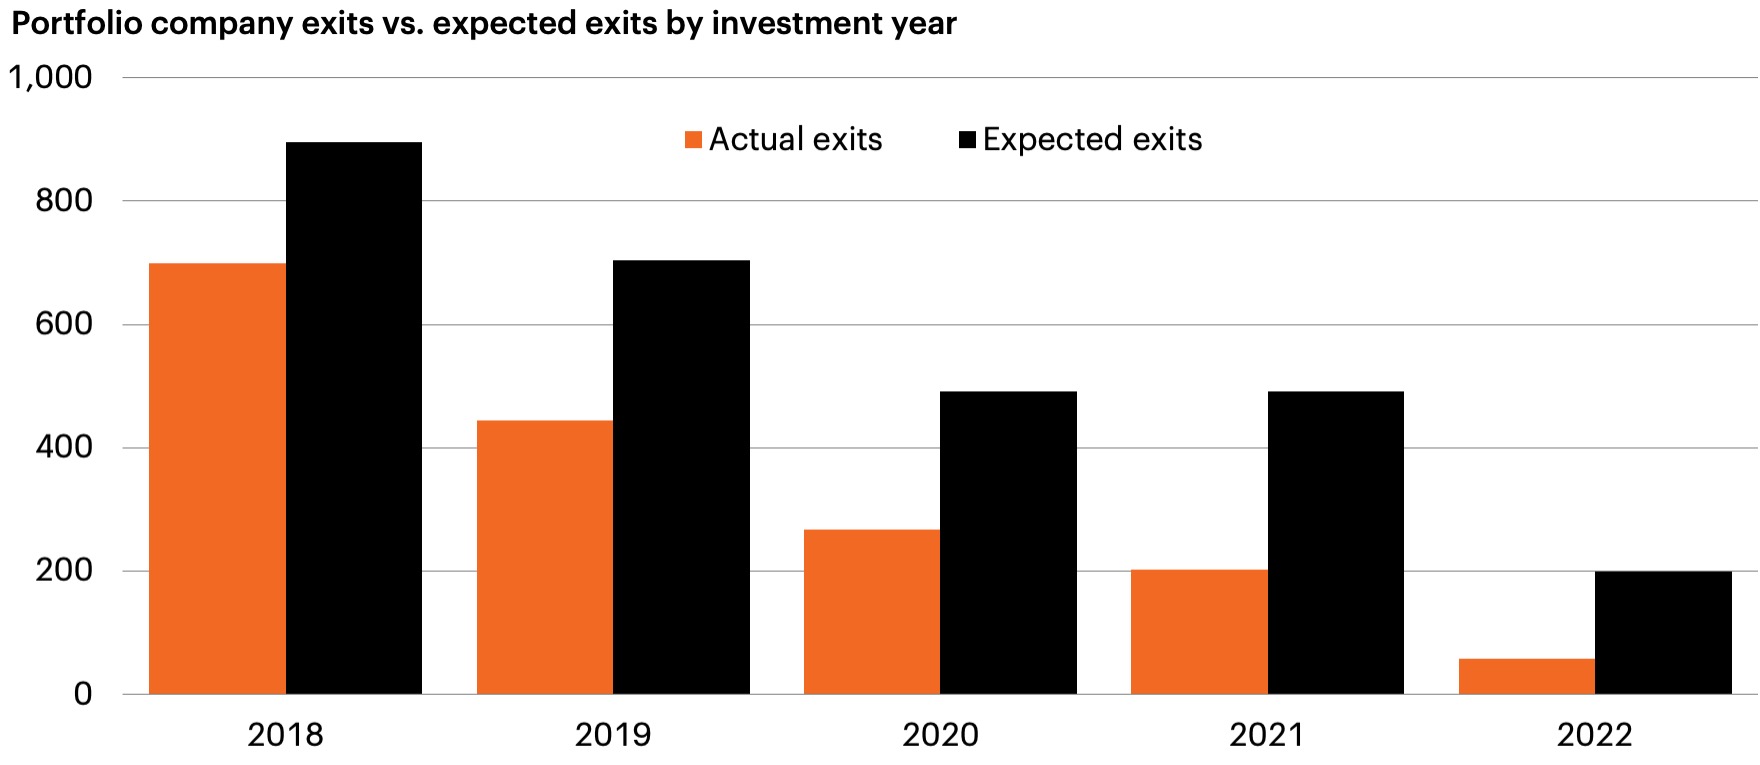
So how does this impact large and mega cap private equity (as well as middle market private equity)? Well, as you know, large and mega cap PE managers have been choking on a lack of monetization/liquidity events in the IPO market for quite some time, which, in turn, has led to:
- Continuous extension of vintages.
- A delay of liquidity returned to investors.
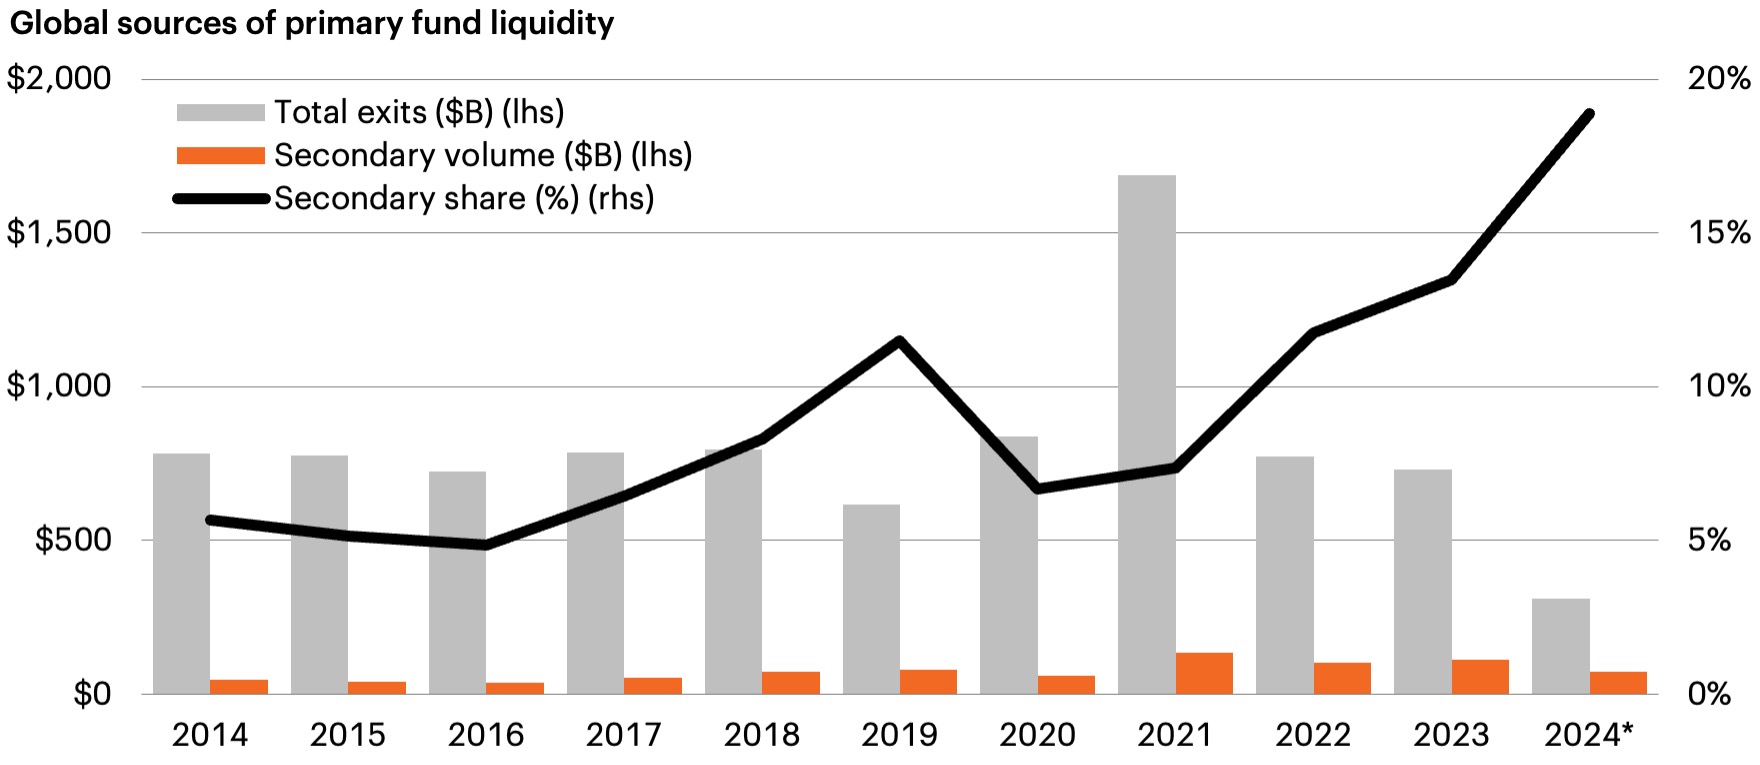
- A longer-than-expected continuation of a booming PE secondary market.
Furthermore, the slowdown in acquisition activity for larger corporations has kept that exit strategy more subdued as well.
U.S. Private equity fundraising by fund size
Source: Preqin. Data as of December 31, 2023.
Inventory of PE firms shows longer J-curve
Source: Pitchbook. Data as of September 30, 2024. Historical period represented by all PE-backed companies for vintages from 2000 to 3Q 2004.
Capital providers have robust opportunity ahead
Source: Pitchbook. Data as of June 30, 2024. Jeffries. Data as of June 30, 2024. Dry powder estimate provided by Preqin. Data as of October 31, 2024.
Thus, expanding corporate activity should at least help large and mega cap private equity firms slow this trend of choking on a lack of monetization/liquidity events in the IPO market. Expanding corporate activity should also help those firms through acquisitions, which, in turn, should slow further growth in large and mega cap secondary volume and put further upward pressure on large and mega cap secondary prices.
As a reminder, middle market monetization events are far less dependent on the IPO market, as you can see from the chart below.
More exit optionality as IPOs fail
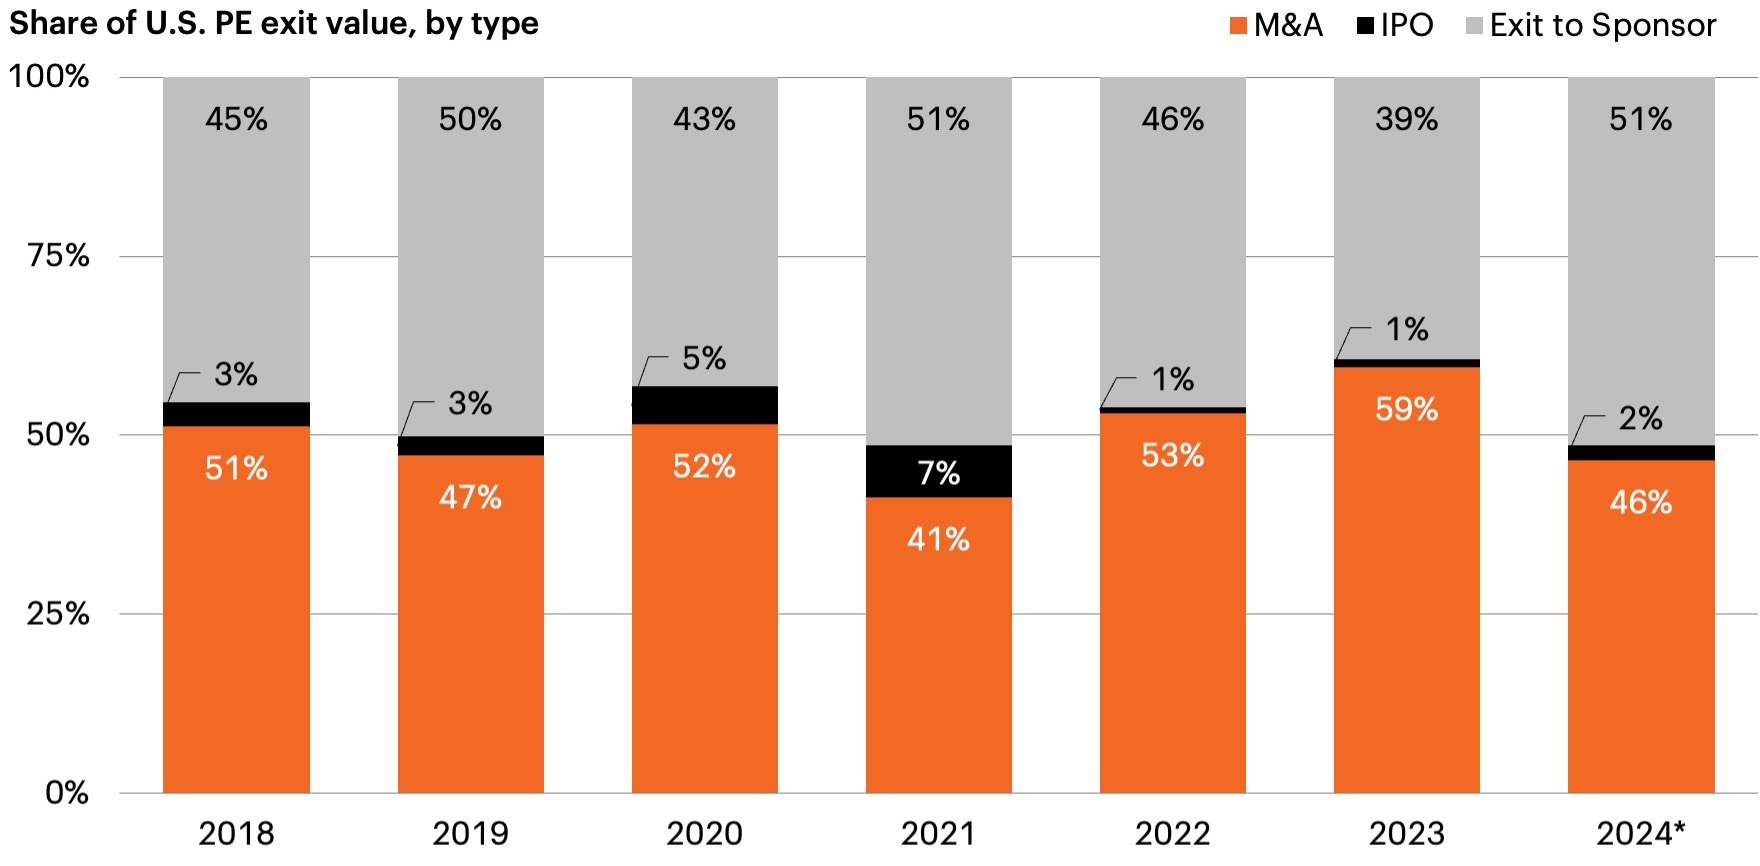
Source: Pitchbook U.S. Private Equity Middle Market Report as of 6/30/2024.
However, since one of the two key exit strategies is selling to a larger private equity/LBO entity, I would generally prefer large and mega cap buyout funds not extending out further from here because, if that were to happen, they would eventually raise far less new capital and have less recycled capital to buy smaller middle market privately held companies. In which case, mega cap dry powder, as shown in the chart below, would continue to dwindle. This could increase the dependency of middle market private equity on the IPO market.
Meaningful dry powder from up market sponsors
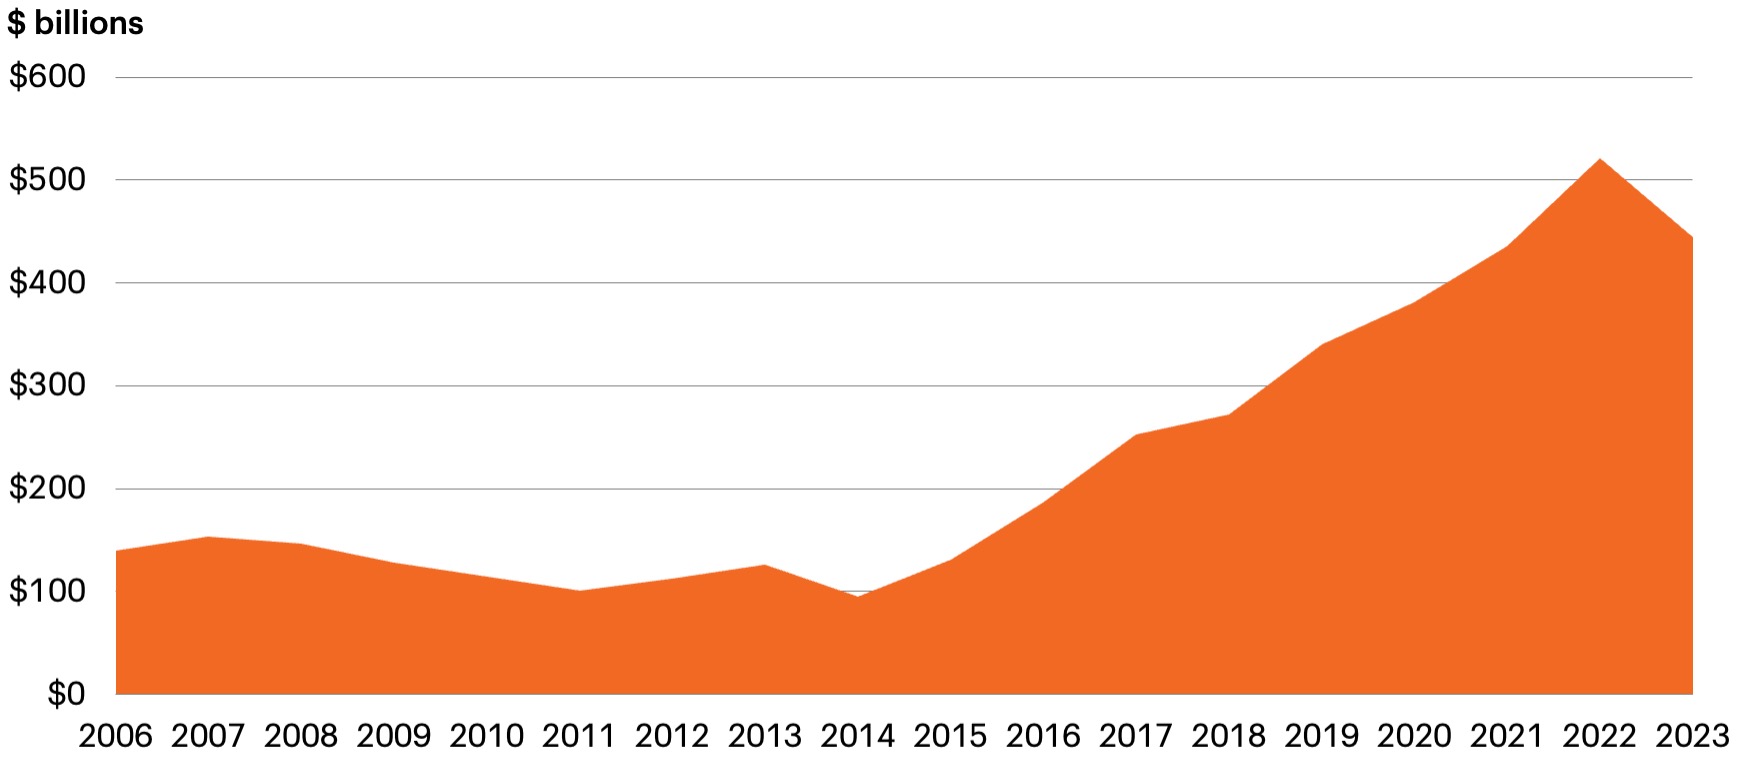
Source: Pitchbook, as of December 31, 2023. Mega-cap funds are defined as having $5B in AUM or more.
Conclusion: Middle market private equity as the epitome of GARP
It is pretty clear if you are investing in equity for growth (please remind me what other possible reason there could be for investing in the bottom of any capital structure) at a reasonable price, middle market private equity is potentially the place to be.
Furthermore, the post-election spread between public and private equity valuations is unsustainable, which is more than likely going to lead to that long-awaited private market valuation/multiple expansion.
Corporate deal activity should pick up substantially, which should provide large and mega cap private equity firms with more dry powder to do what they do best: Buy smaller private companies!
A final word on the “right” alternatives
I always say “the time for the RIGHT alts is still now” for a reason. As alternatives have grown in size, scale, breadth and depth, an investor has to be more discerning about which alternative strategies to embrace.
As we discussed above, there is a big difference between middle market private equity and large and mega cap. There is arguably a bigger difference between a senior secured credit REIT and an equity REIT. Lastly, there is a huge difference between a clean vintage middle market private credit strategy with a complementary focus on asset-based lending and middle market private credit funds that lent aggressively in 2021, when the competition for lending volume from banks was fierce.
So, choose your strategy wisely.
Investing in alternatives is different than investing in traditional investments such as stocks and bonds. Alternatives tend to be illiquid and highly specialized. In the context of alternative investments, higher returns may be accompanied by increased risk and, like any investment, the possibility of an investment loss. Investments made in alternatives may be less liquid and harder to value than investments made in large, publicly traded corporations. When building a portfolio that includes alternative investments, financial professionals and their investors should first consider an individual’s financial objectives. Investment constraints such as risk tolerance, liquidity needs and investment time horizon should be determined.


