A missing piece of many private credit allocations
In the wake of the Global Financial Crisis and a wave of regional bank failures in 2023, banks continue to rein in risk-taking, exit non-core businesses and narrow their focus to core sectors and clients. Private, non-bank lenders have stepped into the void to meet the diverse borrowing needs of companies and individuals alike, creating a significant investment opportunity within the private asset-based finance market — a missing piece of many private credit allocations.
What is asset-based finance?
In the simplest terms, asset-based finance (ABF) encompasses a diverse range of investments backed by large, diversified pools of hard or financial assets that generate recurring cash flows (Figure 1).
ABF is critical to a well-functioning economy, helping meet the financing needs of a wide range of borrowers including homeowners, car buyers, merchants, real estate developers, airlines, small businesses and even intellectual property owners.
Figure 1: Examples of asset-based finance investments
| Definition | Collateral | Reocurring cash flows | |
| Hard assets | Tangible or physical assets | Aircraft | Long-term leases |
| Single-family homes | Rental payments | ||
| Financial assets | Pools of loans, leases or mortgages | Auto loans | Monthly car payments |
| Equipment leases | Lease payments | ||
| Contractual cash flows | Backed by cash flow-producing assets such as intellectual property & royalties | Music royalties | Streaming revenue |
Corporate credit vs. private asset-based finance
Private ABF falls under the broad umbrella of private credit. We believe it’s important to distinguish between private corporate credit (i.e., direct lending strategies) and asset-based finance. Both strategies are privately originated, structured and negotiated between the lender and borrower, or buyer and seller of the assets.
However, the performance drivers for corporate credit and ABF tend to be highly complementary and distinct given the materially different sources of underlying cash flows (Figure 2). These differences are one of the key reasons we believe ABF is a key component of a well-diversified private credit allocation, and often underrepresented in broader portfolio construction.
Figure 2: Cash flow sources for corporate credit vs. private ABF
Corporate credit
(i.e., direct lending or cash-flow lending)
Typically, dependent on the performance and enterprise value of a single corporate borrower.

Private asset-based finance
Typically backed by a pool of hundreds (if not, thousands) of underlying loans, leases or other financial assets or hard assets, such as aircraft, railcars or solar panels.

Private ABF: Growing fast to fill a void
The Global Financial Crisis was a critical turning point in the private ABF market’s evolution. Following the crisis, banks reined in risk-taking, exited non-core business and raised reserves to comply with a wave of new banking regulations. The wave of regional bank failures in 2023 further exacerbated these trends.
As a result, a vast cohort of creditworthy consumer and commercial borrowers, including prime and super prime borrowers, are underserved for their vast financing needs. This environment has created a massive opportunity for private lenders to help fill the void, deliver customized financing solutions to borrowers and drive significant growth in private ABF assets globally (Figure 3).
Figure 3: ABF market share by lender type

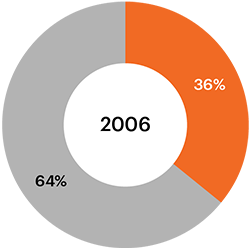
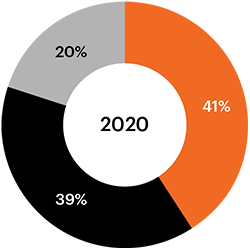

Source: Integer Advisors and KKR research estimates on country-specific sources and trade bodies as well as company reports as of October 31, 2022.
The ABF market now eclipses the combined size of the U.S. high yield bond, the leveraged loan and the direct lending markets. We believe the continued retrenchment of traditional bank financing and technological adoption by consumers and innovation among lenders will continue to spur rapid growth in the coming years (Figure 4).
Figure 4: Size of ABF market ($ trillions)

Source: Integer Advisors forecast and KKR research estimates as of October 31, 2022.
Private ABF vs. public ABS: What difference does a letter make?
Just like the corporate credit markets have syndicated markets (high yield bonds, syndicated bank loans) and private markets (direct lending), asset-based finance has a private and syndicated market, referred to as the asset-backed securities (ABS) market.
Public asset-backed-securities: Individual loans bundled together by a securities dealer (commercial or investment bank) and sold to many investors who can trade them in secondary markets with varying degrees of liquidity across market cycles. ABS issuance declined significantly following the Global Financial Crisis, driven by a sharp reduction in subprime mortgage-backed securities, yet remains a critical source of financing for corporate and individual borrowers. (Figure 3).
Private ABF: Privately originated transactions with the terms negotiated directly between the lender and borrower.
The four primary ABF sectors
The opportunity in ABF can be broken down into four main sectors, each with distinct fundamentals supporting the cash flow generation of the underlying assets (Figure 5). Depending on the ABF strategy, an investment manager may acquire or lend against these large, diversified asset pools.
Figure 5 shows examples within each sector based on the attributes and investment themes driving the opportunity in today’s market. These investments were made by various investment funds and sourced through KKR’s credit business.
Figure 5: Primary private ABF sectors
| Financial assets: Consumer finance | ||
| Auto lending | Consumer loans | Mortgages |
|
||
|
||
| Financial assets: Commercial finance | |
| Receivables financing | Equipment leases |
|
|
|
|
| Hard assets | |
| Single-family rentals | Aircraft |
|
|
|
|
| Contractual cash flows | |
| Royalties | Intellectual property |
|
|
|
|
Source: https://media.kkr.com/
Tailor-made structures can help meet diverse borrower needs
The ability of private ABF lenders to deliver customized financing solutions has been a key driver of growth. Private ABF lenders have the flexibility to work with borrowers to determine the optimal way to structure each transaction based on the type, cash flow potential and duration of the collateral, among other considerations.
Figure 6: Private ABF investment structures
| Portfolio acquisitions | Direct acquisition of portfolios of financial and hard assets | Structured investments | Issuance of new debt and/or equity securities backed by the underlying financial and hard assets |
| Secured lending | Lending against pools of financial and hard assets, such as accounts receivable | Platform investments | Investing in an existing lending business or backing an experienced operating team to form a new company/investment vehicle |
Implementing private ABF in a portfolio
The diverse makeup of the private ABF market across many industries and asset types provides ABF investment managers the opportunity to tailor portfolios to meet precise risk and return criteria and pivot when certain parts of the ABF market offer particularly attractive relative value.
We believe an allocation to private ABF can bolster traditional portfolios in several important ways.
- Provide a high level of current income and the potential for strong risk-adjusted returns (Figure 7).
- Diversify corporate credit allocations and expand a private credit allocation beyond direct lending strategies (Figure 8).
- Serve as a hedge against inflation, as the value of the collateral backing ABF transactions tends to rise with inflation— especially hard assets.
Figure 7: Comparison of market yields
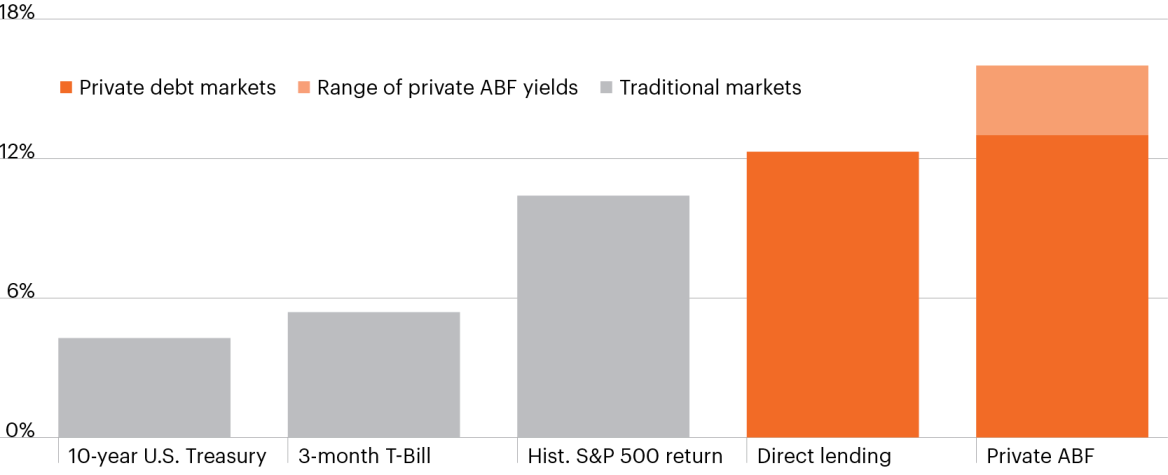
Source: NCREIF/CREFC, Cliffwater, KKR, Bloomberg Finance, L.P. Based on latest available data as of February 28, 2024. Historical S&P 500 return uses a 60-year lookback period.
Figure 8: Correlation table

The table above reflects the correlation between market movements (which may be positive or negative) of the asset classes represented in the table from the period commencing Q3 2017 (the earliest available data point) up to and including Q3 2023 based on their respective gross returns during this period (for example, a correlation of 1 between asset classes would indicate that market movements of both asset classes (whether positive or negative) during the period were identical).
Source: Bloomberg, unless otherwise noted. Gross performance of each asset class is based on gross quarterly returns of the following indices: Treasuries (Bloomberg U.S. Treasury Index), U.S. Agg (Bloomberg U.S. Agg TR Unhedged USD Index), Investment Grade Bonds (Bloomberg U.S. Corporate Index), High Yield Bonds (Bloomberg Corporate HY Index), Leveraged Loans (Morningstar LSTA U.S. Leveraged Loan Index), U.S. Direct Lending (Cliffwater Direct Lending Index; Source – Cliffwater), Asset-Based Finance (KKR Private Credit ABF Composite; Source – KKR Credit). See Important Information for additional detail about the use of indexes. Historic market trends are not reliable indicators of actual future market behavior including future correlations of any asset classes referred to above.
Conclusion
We believe continued disruption in the banking sector will continue to drive significant opportunities for private ABF to step in and fill the void as either a capital provider or a buyer of assets at attractive terms. For investors, an allocation to private ABF offers a timely opportunity to complement existing corporate credit and private debt allocations or gain exposure to a diversified segment of the market and economy.
View important footnotes + disclosures
This information is educational in nature and does not constitute a financial promotion, investment advice or an inducement or incitement to participate in any product, offering or investment. Neither FS Investments nor KKR is adopting, making a recommendation for or endorsing any investment strategy or particular security. All views, opinions and positions expressed herein are that of the author and do not necessarily reflect the views, opinions or positions of FS Investments or KKR. All opinions are subject to change without notice, and you should always obtain current information and perform due diligence before participating in any investment. Neither FS Investments nor KKR provides legal or tax advice and the information herein should not be considered legal or tax advice. Tax laws and regulations are complex and subject to change, which can materially impact any investment result. FS Investments and KKR cannot guarantee that the information herein is accurate, complete, or timely. FS Investments and KKR make no warranties with regard to such information or results obtained by its use, and disclaims any liability arising out of your use of, or any tax position taken in reliance on, such information.
Any projections, forecasts and estimates contained herein are based upon certain assumptions that the author considers reasonable. Projections are necessarily speculative in nature, and it can be expected that some or all of the assumptions underlying the projections will not materialize or will vary significantly from actual results. The inclusion of projections herein should not be regarded as a representation or guarantee regarding the reliability, accuracy or completeness of the information contained herein, and neither FS Investments nor KKR is under any obligation to update or keep current such information.
All investing is subject to risk, including the possible loss of the money you invest.