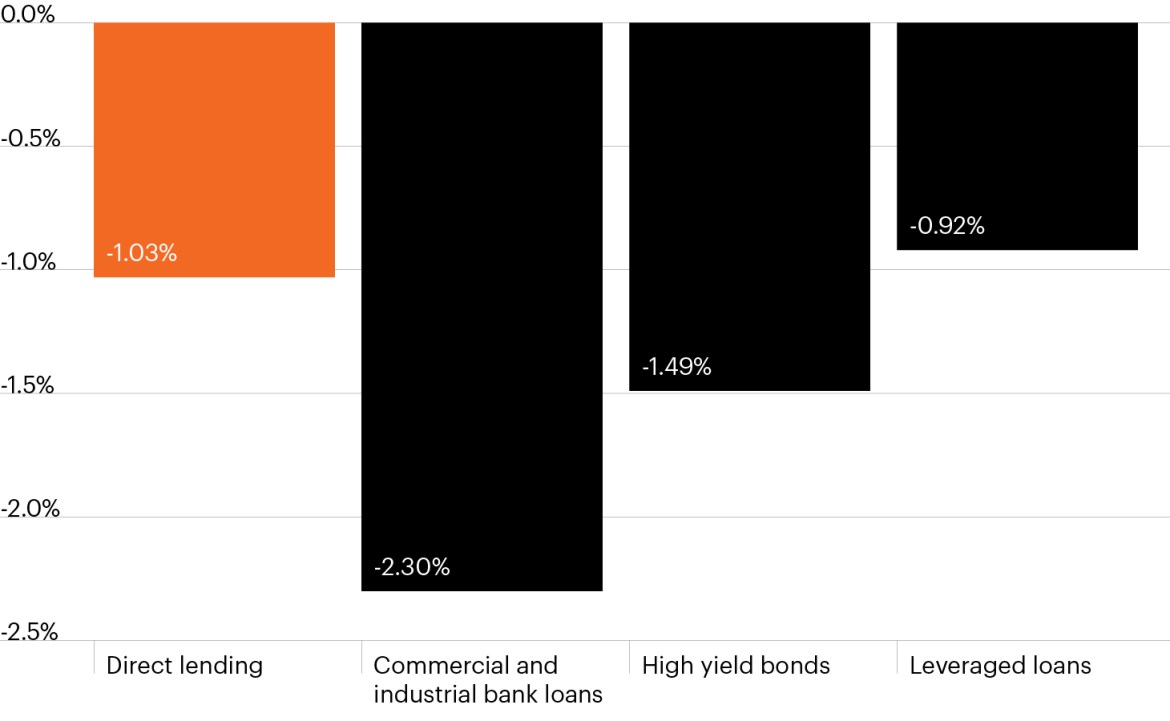
Historical loss rate (Annualized credit loss since 2005)

Data as of Q4 2023. Direct lending data based on Cliffwater Direct Lending Index. Commercial and industrial bank loans based on Federal Reserve data. High yield bond data based on Bloomberg U.S. Corporate High Yield Total Return Index. Leveraged loan data based on Morningstar S&P/LSTA Leveraged Loan Index.
- The growth of the direct lending market has garnered both the enthusiasm of investors and skepticism from some participants who question the ability for private borrowers to weather a potential slowdown in the U.S. economy and/or withstand a higher-for-longer interest rate environment.
- If direct lending was inherently riskier than other areas of the leveraged finance market, one might expect the historical loss rate to be higher over the long term.
- However, this is not the case as the chart illustrates. The annualized loss rate for direct lending is -1.03%, roughly in line with leveraged loans and below that of high yield bonds and commercial and industrial loans (i.e., corporate lending by banks).1 In addition, the direct lending default rate is currently below the syndicated loan markets.
- Much of this performance can be attributed to the strong fundamentals underpinning many companies that comprise the U.S. middle market, representing approximately 200,000 companies with annual revenues between $10 million and $1 billion.2 Middle market companies on average source 84% of their revenues from domestic customers and grew revenues 12.4% in 2023, far outpacing that of S&P 500 companies (+5%).2,3


