Chart of the week

A challenged 60/40 highlights the need for alts

The 60/40 may have thrived in the past, but today, alternative investments appear better-positioned across these four key metrics.

Four column charts contrasting the prevailing investments environments between the 2010s and 2020s. During the 2010s, the Bloomberg Agg featured a lower standard deviation (2.9%) than the 2020’s (6.4%) while stocks and bonds featureed negative correlation in the 2010s (-0.47) compared to 0.30 during the 2020s. Stocks are significantly more concentrated today as the top 10 stocks in the S&P 500 account for 30% of the index compared to 20% in the 2010s. The S&P 500’s average P/E multiple is significantly more expensive in the 2020s (19.4x) compared to 15.2x for the 2010s.

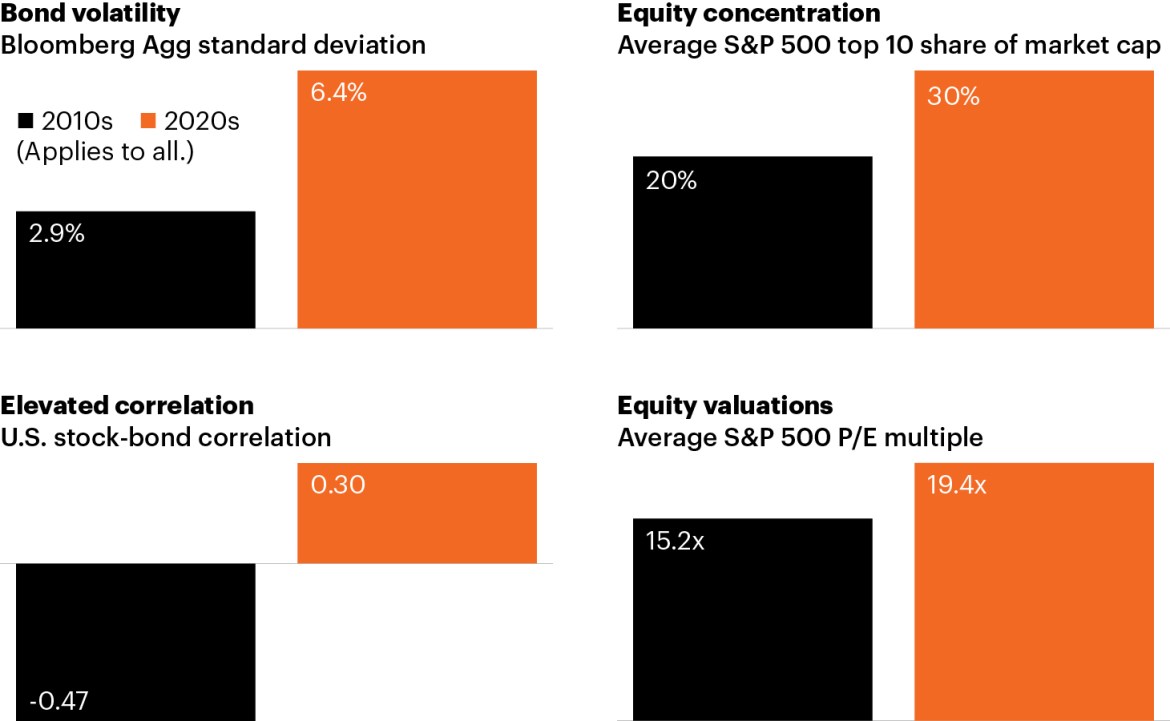
Source: Bloomberg Finance, L.P., as of June 30, 2024, for each of the four charts. Data reflect averages for each respective time period.

  • The investment case for alternatives has rarely been more attractive as today’s macro environment has evolved in ways that are notably less conducive to the traditional 60/40 portfolio. The above charts highlight four important reasons why alts may be well-positioned within today’s macro backdrop.
  • Driven by significant interest rate volatility, core fixed income is more volatile today than during the 2010s (upper left chart).1 Equity and fixed income markets are also more correlated today than during the 2010s, when core fixed income provided a balance against volatile equity markets (lower left).1
  • Meanwhile, investing in the S&P 500 increasingly implies a concentrated bet on the Magnificent 7, an inescapable group of U.S. tech and tech-related firms. As the charts at right highlight, the Index is significantly more concentrated—and expensive—than during the 2010s, calling into question stocks’ forward-looking return potential.
  • Allocating to alternative investments may provide investors with differentiated sources of current income, growth and diversification at a time when traditional assets face headwinds.
  • Alternative investments have also garnered increased attention as advisors are learning that alts may help them differentiate their practice and win wallet share among new and existing clients.

  • Bloomberg Finance, L.P., as of June 30, 2024, for each of the four charts. Data reflect averages for each respective time period.

The chart of the week and any accompanying data is for informational purposes only and shall not be considered an investment recommendation or promotion of FS Investments or any FS Investments fund. The chart of the week is subject to change at any time based on market or other conditions, and FS Investments and FS Investment Solutions, LLC disclaim any responsibility to update such market commentary. The chart of the week should not be relied on as investment advice, and because investment decisions for the FS Investments funds are based on numerous factors, may not be relied on as an indication of the investment intent of any FS Investments fund. None of FS Investments, its funds, FS Investment Solutions, LLC or their respective affiliates can be held responsible for any direct or incidental loss incurred as a result of any reliance on the chart of the week or other opinions expressed therein. Any discussion of past performance should not be used as an indicator of future results.

This information is educational in nature and does not constitute a financial promotion, investment advice or an inducement or incitement to participate in any product, offering or investment. FS Investments is not adopting, making a recommendation for or endorsing any investment strategy or particular security. All views, opinions and positions expressed herein are that of the author and do not necessarily reflect the views, opinions or positions of FS Investments. All opinions are subject to change without notice, and you should always obtain current information and perform due diligence before participating in any investment. FS Investments does not provide legal or tax advice and the information herein should not be considered legal or tax advice. Tax laws and regulations are complex and subject to change, which can materially impact any investment result. FS Investments cannot guarantee that the information herein is accurate, complete, or timely. FS Investments makes no warranties with regard to such information or results obtained by its use, and disclaims any liability arising out of your use of, or any tax position taken in reliance on, such information.

Any projections, forecasts and estimates contained herein are based upon certain assumptions that the author considers reasonable. Projections are necessarily speculative in nature, and it can be expected that some or all of the assumptions underlying the projections will not materialize or will vary significantly from actual results. The inclusion of projections herein should not be regarded as a representation or guarantee regarding the reliability, accuracy or completeness of the information contained herein, and neither FS Investments nor the author are under any obligation to update or keep current such information.

All investing is subject to risk, including the possible loss of the money you invest.

Search our site