Chart of the week

Election anxiety comes into focus for markets

This week’s chart highlights perceived market drivers over the next 30 days. Notably, the downside drivers outweigh the upside.

Subscribe to the Chart of the week newsletter
August 16, 2024 | 2 minute read

Investor survey: Major equity drivers for the next 30 days

Column chart showing the results of a poll surveying investment managers’ views on market drivers over the next 30 days. Results were decidedly bearish, with the political environment and equity valuations among the largest expected drivers of negative returns. These factors more than offset supportive central bank policies and equity fundamentals in participants’ views.

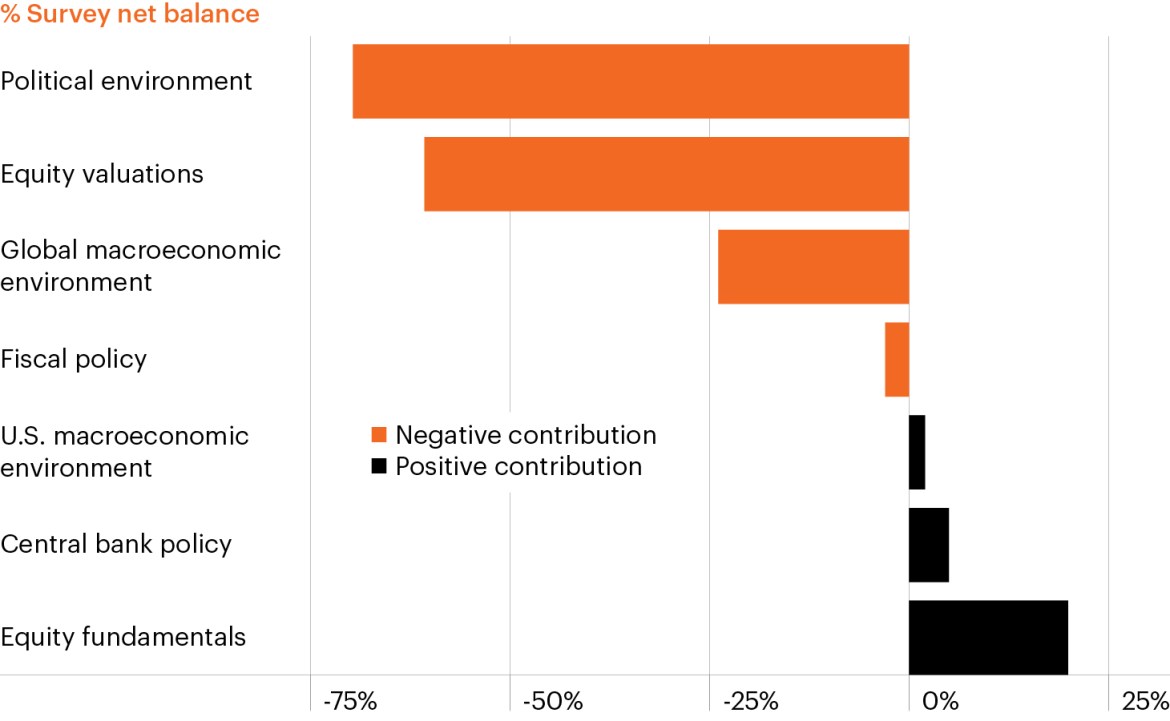
Source: S&P Global Investment Manager Index, based on survey data collected from August 6-9, 2024. The net balance shows the percentage of those reporting an expected positive contribution minus those expecting a negative contribution. Those only reporting a ‘slight’ positive or negative contribution count as half a response, while those reporting a ‘strong’ positive or negative contribution count as one-and-a-half responses.

  • Markets have been extraordinarily volatile over the past month, driven by slowing employment data, continued geopolitical tensions and rapidly changing election dynamics. Many investment managers expect the volatility to stay heightened for some time.
  • According to a recent S&P Global Investment Manager Index survey, perceived risks have begun to outweigh potential return drivers, reversing an extended period of relative market calm.
  • The political environment has quickly raced to the top of investors’ concerns and could remain there through the election. Meanwhile, anxiety surrounding rich equity valuations has been background noise for many investors over most of the past year and remain a concern for many investors.
  • Against this backdrop, alternative investments that seek to provide differentiated sources of income, growth and diversification may be particularly important should markets remain as choppy as investors anticipate.

The chart of the week and any accompanying data is for informational purposes only and shall not be considered an investment recommendation or promotion of FS Investments or any FS Investments fund. The chart of the week is subject to change at any time based on market or other conditions, and FS Investments and FS Investment Solutions, LLC disclaim any responsibility to update such market commentary. The chart of the week should not be relied on as investment advice, and because investment decisions for the FS Investments funds are based on numerous factors, may not be relied on as an indication of the investment intent of any FS Investments fund. None of FS Investments, its funds, FS Investment Solutions, LLC or their respective affiliates can be held responsible for any direct or incidental loss incurred as a result of any reliance on the chart of the week or other opinions expressed therein. Any discussion of past performance should not be used as an indicator of future results.

This information is educational in nature and does not constitute a financial promotion, investment advice or an inducement or incitement to participate in any product, offering or investment. FS Investments is not adopting, making a recommendation for or endorsing any investment strategy or particular security. All views, opinions and positions expressed herein are that of the author and do not necessarily reflect the views, opinions or positions of FS Investments. All opinions are subject to change without notice, and you should always obtain current information and perform due diligence before participating in any investment. FS Investments does not provide legal or tax advice and the information herein should not be considered legal or tax advice. Tax laws and regulations are complex and subject to change, which can materially impact any investment result. FS Investments cannot guarantee that the information herein is accurate, complete, or timely. FS Investments makes no warranties with regard to such information or results obtained by its use, and disclaims any liability arising out of your use of, or any tax position taken in reliance on, such information.

Any projections, forecasts and estimates contained herein are based upon certain assumptions that the author considers reasonable. Projections are necessarily speculative in nature, and it can be expected that some or all of the assumptions underlying the projections will not materialize or will vary significantly from actual results. The inclusion of projections herein should not be regarded as a representation or guarantee regarding the reliability, accuracy or completeness of the information contained herein, and neither FS Investments nor the author are under any obligation to update or keep current such information.

All investing is subject to risk, including the possible loss of the money you invest.

Search our site