

Warren Buffett’s investing wisdom is famously encapsulated in his top two rules: “Rule No. 1: Never lose money. Rule No. 2: Never forget Rule No. 1.” This simple yet underappreciated advice underscores the critical concept of asymmetrical risk-reward in investing, where the potential for gains outweighs the potential for loss. Understanding and applying this principle is crucial for investors. By focusing on investments with strong risk-adjusted returns investors can better protect their capital and achieve more consistent long-term growth.
The most widely used method for evaluating an investment’s risk-adjusted return is Sharpe ratio, which measures an asset’s return above the risk-free rate per unit of volatility. On the surface, this makes sense as more volatility usually begets greater risk. However, when an investment’s standard deviation is skewed to the upside, meaning the volatility is generating positive returns, Sharpe becomes a less effective proxy for risk. After all, if an investment’s value jumps higher, the magnitude of the increase isn’t really a concern. We argue a better metric for assessing risk-adjusted returns is loss potential rather than volatility.
Rule No. 3: Calmar is king
If Buffett’s top two rules of investing emphasize capital preservation, the unofficial third rule should be rooted in an investment’s Calmar ratio. The Calmar ratio, like Sharpe, measures an investment’s return above the risk-free rate, but it does so against maximum drawdown—the largest peak-to-trough decline during a specific period—rather than volatility. By focusing on maximum drawdown, the Calmar ratio offers a more precise measure of risk-adjusted returns, as it provides a clearer picture of an investment’s downside risk and resilience during market downturns, particularly for long-term investments. Therefore, the Calmar ratio can be thought of as the capital preservation-adjusted return of an investment.
Calmar in context
The Calmar ratio reflects the symmetry—or asymmetry as is more often the case—of an investment’s upside vs. downside potential. The higher the Calmar ratio, the more attractive the investment. A Calmar ratio above 1 denotes a positive asymmetric return profile, meaning there is more upside than downside potential, while a ratio below 1 denotes negative asymmetry, and greater downside potential. In a perfect world an investment would have all upside and no downside. However, most investments, aside from cash, are skewed to downside risk as illustrated below.
Traditional investments historically have a Calmar < 1.0

Source: Morningstar, as of June 30, 2024.
Why understanding downside is critical to capturing upside
When analyzing an investment, investors often focus more on return potential than risk and usually assume the investment will generate positive returns. But what if that assumption is wrong? How wrong could it be, and how quickly can losses be recouped? After a drawdown an investment needs to return more than it lost to break even. Due to this outsized cost of recovery it’s crucial to assess downside risk.
Consider the simple math: If an investment worth $1.00 loses 20% and then gains 20%, it’s only worth $0.96. To break even, it needs to gain 25%. This highlights the importance of understanding and managing downside risk.
The chart below demonstrates the significance of this concept with a real-life example. During the equity market pullback in 2022, the S&P 500 fell 25% between the months of January and October. A $100,000 investment in the S&P 500 on January 1, 2022, would have lost $25,425 by the time the market bottomed in October. It would have taken until January 2024 once the S&P 500 returned 34% from the market trough for the investment to be back at breakeven—a stark contrast to the 25% drawdown.
S&P 500’s drawdown in 2022
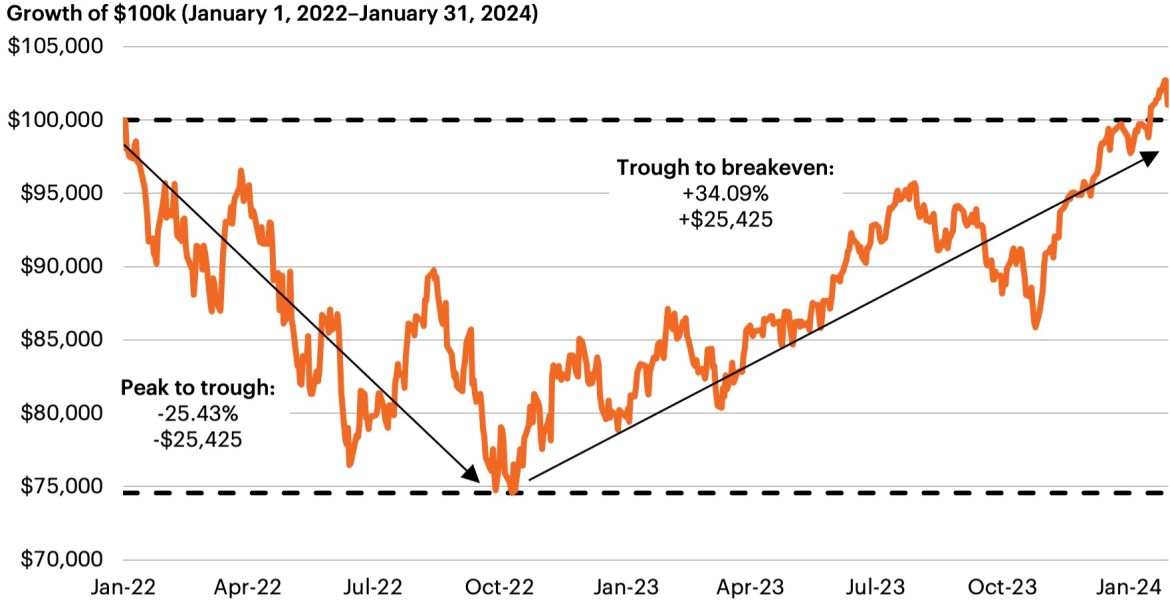
Source: Bloomberg Finance, L.P., FS Investments, as of June 30, 2024.
Speed of recovery also adds to the difficulty of getting an investment back to par, as in reality large drawdowns are rarely followed by rallies of the same magnitude. This was seen in the 2022 drawdown, during which it took the S&P 500 approximately 10 months to bottom out and 15 months to recover. 2022 was not an anomaly. Equity markets tend to take the elevator down in market pullbacks and the stairs back up to recovery. When looking at the five largest equity market drawdowns over the last 50 years, the average period from market trough to breakeven is 3.4x longer than the average peak to trough period as shown below. Thus, understanding how to preserve capital is just as crucial, if not more so, as evaluating an investment’s upside potential.
Market recoveries historically take much longer than drawdowns

Source: Bloomberg Finance, L.P., FS Investments, as of June 30, 2024.
Taking asymmetric returns from theory to practice
Given there is no asset with better asymmetry than cash, it provides a risk-free rate to serve as the baseline for evaluating risk-adjusted returns. To build more resilient portfolios, an investor must understand how an asset’s risk and return are priced relative to cash. It is also critical to understand that when the risk-free rate is high—as it is in the current market—investors are forced to take on more risk to generate the same excess return potential.
In financial theory, this relationship is often represented by a graph that charts an asset’s expected return over cash (i.e., the risk-free rate) as a function of its risk. This is the basis for Calmar ratio, whereby risk is represented by an investment’s historical maximum drawdown.
The chart below employs the Calmar ratio components to illustrate the relationship between an asset’s risk-adjusted returns and the level of return on cash. Using real-time numbers, we show the S&P 500, which has generated a 10% annualized return with a maximum drawdown of 50% over the last 20 years. With cash yields at 5% today, the S&P 500 offers a 5% excess return relative to its historical average. This implies that for every 1% earned above cash, an investor in the S&P 500 risks losing 10% of their investment.
This risk-return scenario is very different when cash returns 0%, as was largely the case immediately prior to the current rate hike cycle. In that case, for each 1% an investor earns above cash, history would say that the maximum potential drawdown is only 5%—half the downside risk compared to today’s market.
Risk-return of the S&P 500 when RFR rate is at 0% vs. 5%

Source: Bloomberg Finance, L.P., FS Investments, as of December 31, 2024.
This framework underscores a logical perspective: The attractiveness of an investment, in this example equities, diminishes when cash yields are higher as the incremental upside relative to the risk-free rate shrinks while the potential downside remains unchanged. Investors must then choose between greater proportional downside and lower expected returns. This raises the question—Is there a better option?
Alternatives for asymmetry
Alternative investments, long praised for their diversification benefits and lower volatility compared to traditional investments, become especially compelling when the risk-free rate is elevated. Historically, these investments have shown a positive asymmetric return profile. Over the past 20 years, a portfolio of 40% private equity, 30% private credit, 20% real estate, and 10% hedge funds would have achieved a Calmar ratio of 1.83, significantly outperforming the S&P 500’s 0.18 shown above. Recall that a Calmar ratio greater than 1 indicates a skew towards greater upside potential and reduced downside risk. The chart below highlights the strong asymmetric return profile alternatives have historically offered vs. traditional investments, generating 4x less risk than the traditional 60/40 portfolio and over 2x the return over the last 20 years.
Historical risk-return profile of traditional investments

Source: Bloomberg Finance, L.P., FS Investments, as of December 31, 2024. The Alts Portfolio is 40% Pitchbook North America PE Index, 30% Cliffwater Direct Lending Index, 20% NCREIF Property Index, and 10% Eurekahedge Index.
While alternative investments have historically offered strong risk-adjusted returns, their value proposition is greater in today’s high risk-free rate environment. While traditional investments offer limited excess return over the risk-free rate when adjusted for risk, alternatives offer a powerful solution for enhancing returns while managing risk effectively.


