

Since the conclusion of the last equity market correction in October 2023, markets for the most part have been green-light-go. What might have started as a slight underweight to equities in most investors’ portfolios has been exacerbated with each acute rally, forcing investors to chase market returns. Investor FOMO (fear of missing out) has created an atypical market dynamic with respect to price action whereby equity prices have experienced volatile upward swings and relatively subdued downward moves. As a result, investor confidence has grown and portfolios have become beta-dependent with little to no protection against downside risks. To make matters more concerning, the environment is such that traditional sources of diversification—including bonds and trend-following strategies, such as managed futures—are positioned to only deliver in certain market outcomes, thereby forcing investors to make a macro call when implementing downside protection. Given that diversifiers are intended to offer protection independent of the market outcome, this environment raises doubts about the effectiveness of bonds and trend-following strategies in a portfolio. Thus, investors are in a diversification dilemma, leaving portfolios exposed to looming uncertainties in the current and go-forward market environment and in need of an alternative solution.
FOMO
As hedge funds, asset managers and individual investors alike have been forced to chase the small handful of stocks that have dominated the broader index, equities have experienced frequent and uncharacteristically volatile upward moves in price and relatively subdued downward moves.
We can characterize the current market as being in a FOMO state. Historically, the relationship between return and volatility can be defined by four markets.
- Normal: Equities grind higher and experience more volatility on the downside than upside. Examples: 2021, 2019.
- Recession: Equities violently gap lower and experience more volatility on the downside than upside. Examples: 2008, 2001
- FOMO: Equities gap higher and experience more volatility on the upside than downside. Examples: 1999, 2024.
- Deleveraging: Equities grind lower and experience mostly the same volatility on the upside and the downside. Examples: 2002, 2022.
Figure 1: Realized skew can help differentiate between normal and FOMO markets
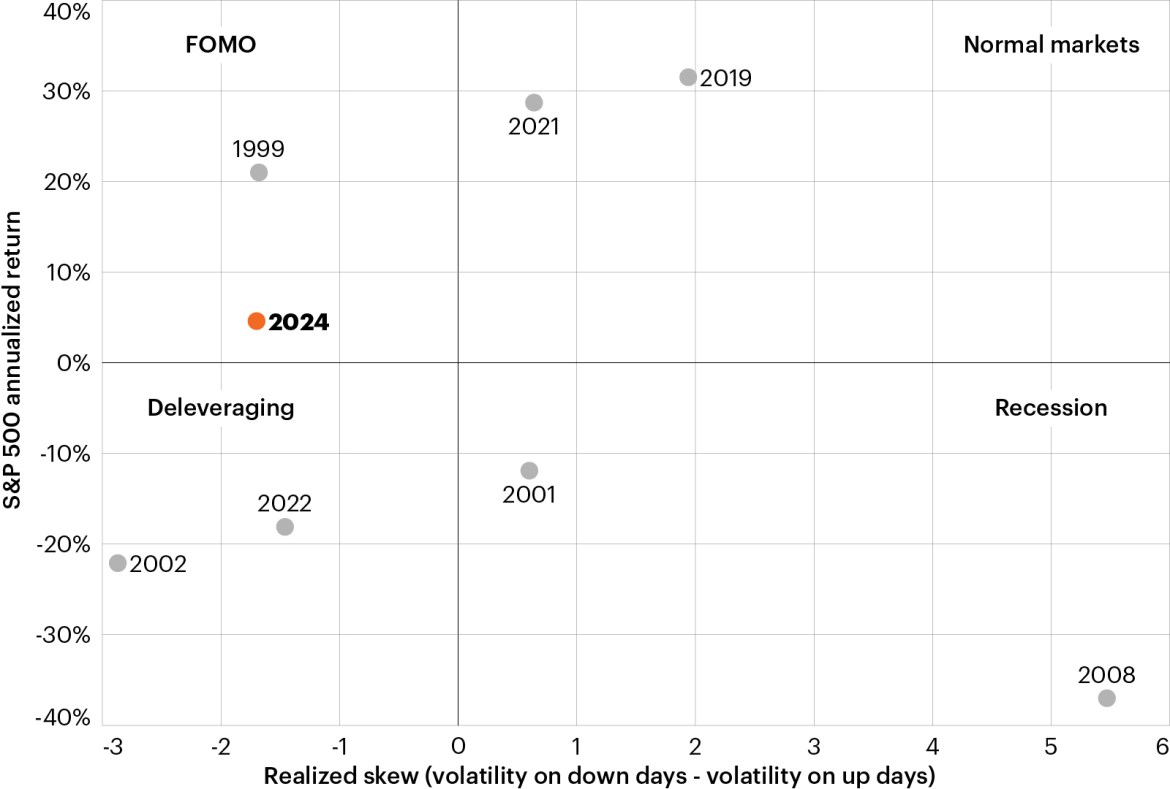
Source: Bloomberg Finance L.P., FS Investments, as of April 24, 2024.
FOMO price action is atypical and can give investors a false sense of security as it’s a self-fulfilling cycle that is both supported by the increasing bet on beta and reinforces confidence in that bet. The risk posed by FOMO price action was demonstrated in 1999 after markets climbed 21%, the three years following returned -9%, -12% and -22%, respectively.1
Year to date, as investor FOMO has increased, the movement in equity market prices has been almost 2x more volatile on the upside than on the downside. The extent of this dislocation, as measured by the spread between the volatility experienced on up days vs. down days, is the largest since 2002 as demonstrated in Figure 2.
Figure 2: Realized skew on the S&P 500 is the most negative since 2002

Source: Bloomberg Finance, FS Investments, as of April 24, 2024.
In addition to FOMO price action, investors have demonstrated a lack of regard for drawdown risk. The minimal demand for downside protection is evidenced by the falling price of volatility premium represented by 6-month 90% put options on the S&P 500 shown in Figure 3. A 6-month 90% put option is a contract that gives the buyer the right to sell an asset at a strike price of 90% of the S&P 500’s current market price within the next six months, providing protection from potential downside risk in equities over the next six months. The price of volatility premium has normalized to pre-COVID levels despite equity valuations sitting at extremes, elevated inflation and slowing growth concerns. This current price level underscores both investor confidence and the potential vulnerability of portfolios.
Figure 3: S&P 500 6-month 90% put price

Source: Bloomberg Finance L.P., as of April 8, 2024.
The diversification dilemma
Stretched equity valuations, higher for longer rates, elevated inflation and continued geopolitical risks are finally forcing investors to reevaluate portfolio positioning and consider solutions that allow for participation as well as protection. But what are the options? Historically, investors have turned to traditional fixed income, i.e., bonds or trend-following strategies, but today we argue that in order for those strategies to serve as diversifiers the investor must get the macro call correct. This raises doubts about their effectiveness in a portfolio.
The apparent unreliability of the 60/40
Long revered as a trusted guidepost for balanced portfolio positioning, the 60/40 is not what it used to be. Bonds are failing to protect when stocks trade lower, as demonstrated by rising stock-bond correlation, which currently sits at the highest level in 40 years as shown in Figure 4.
Figure 4: Correlation between stocks and bonds
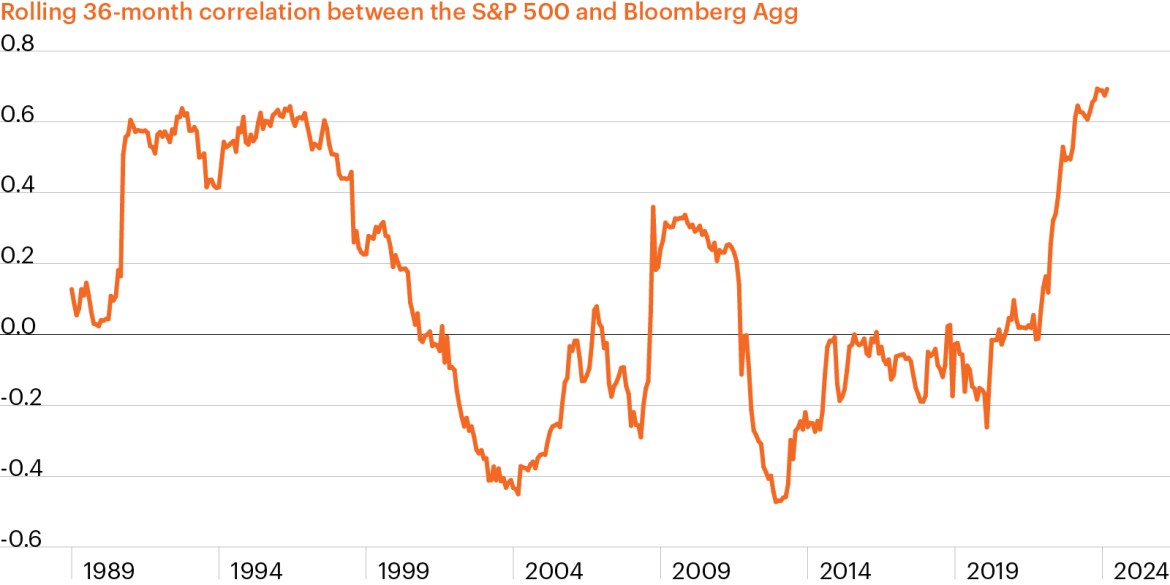
Source: Bloomberg Finance L.P., FS Investments. Rolling 36-month correlation between S&P 500 and Bloomberg Aggregate Bond Index. August 31, 1989–March 31, 2024.
Inflation uncertainty has led to a higher-for-longer environment where bonds are not only failing to diversify but also are exhibiting increasingly greater levels of volatility as demonstrated in Figure 5.
Figure 5: Bond volatility on the rise
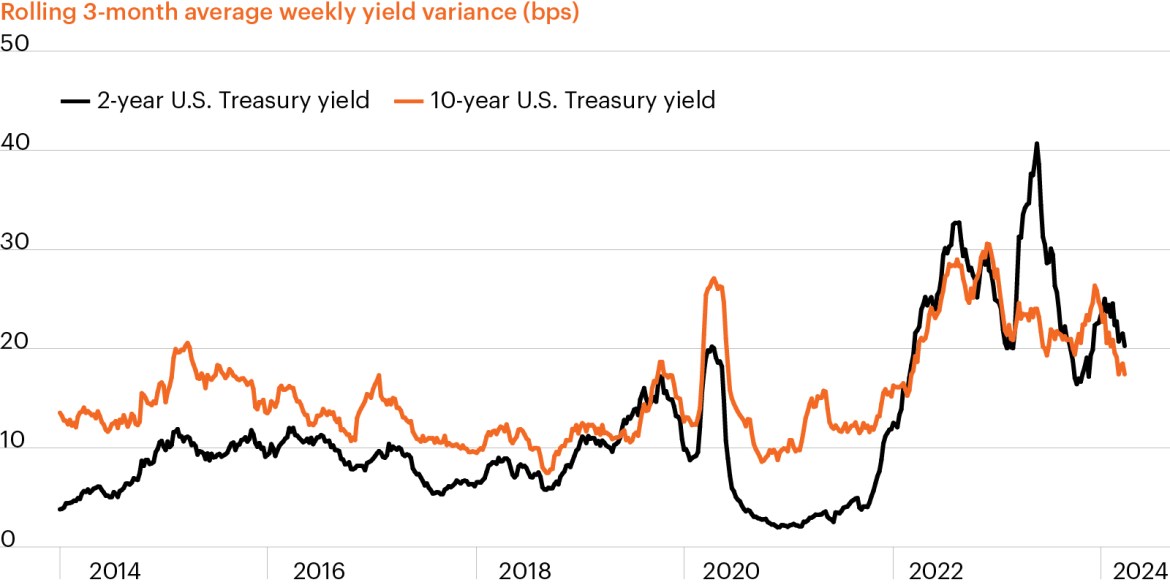
Source: Bloomberg Finance L.P., FS Investments. Rolling 3-month average weekly variance in yield. September 30, 2013–March 31, 2024.
Clearly, the perceived balanced 60/40 portfolio is anything but. Given an uncertain backdrop for bonds, this construct is likely to be challenged going forward.
The latent risks of trend
In addition to traditional fixed income, investors have historically turned to trend-following strategies for downside protection. These are systematic strategies that capitalize on prevailing price trends across asset classes. However, as history has shown, trend-following strategies are a great diversifier until they’re not. These strategies can significantly lean into risk if that is where the trends take them, making their ability to protect extremely dependent on market outcomes and timing. Currently, equity markets have trended one way over the past five months—up—causing trend-followers to dramatically increase their equity exposure. As demonstrated in Figure 6, the equity beta of these strategies sits at 0.71 year to date, meaning they are currently heavily allocated to the same equity risk that investors are looking to protect against and casting doubt on their forward-looking diversification benefits. A similar market setup existed in February 2020. During the March 2020 correction, these strategies not only failed to protect but exacerbated the drawdown, causing portfolios to double down on equity risk.
Figure 6: Trend strategy beta vs S&P 500
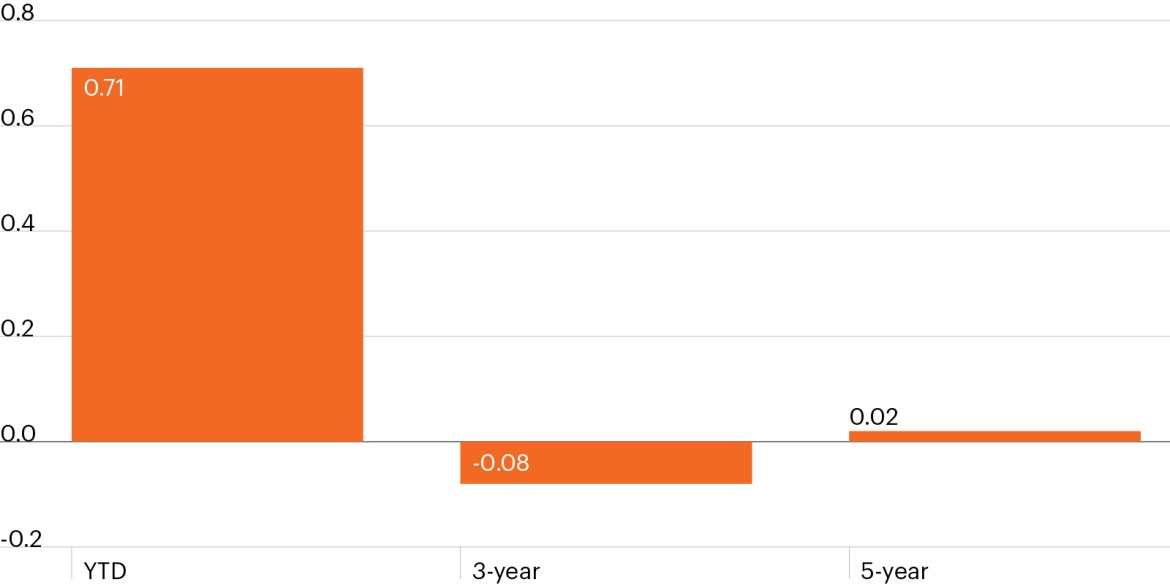
Source: Bloomberg Finance L.P., FS Investments as of March 31, 2024. Trend-following is represented by the HFRI Trend Following Directional Index.
Making matters potentially worse, the long equity positioning is coupled with short duration exposure given the trend of bond yields moving higher. This positioning has worked well this year as these trends have persisted. However, the unexpected growth slowdown scenario that could lead equities to trade lower and bond yields to tumble would be the proverbial double whammy that could torpedo trend-following performance at a time when portfolios need protection the most.
Figure 7 clearly demonstrates the lack of consistent capital preservation offered by traditional fixed income and trend-following strategies. Over the last five years, trend-following strategies yielded positive returns during just four out of the S&P 500’s 10 worst trading months, while bonds offered protection in only two of these months. Remarkably, there were no months in which both strategies provided downside protection simultaneously.
Figure 7: Bond and trend strategy capital preservation vs. S&P 500

Source: Bloomberg Finance L.P. as of March 31, 2024. Trend-following is represented by the HFRI Trend Following Directional Index.
The clear solution
Portfolios are in a precarious position of beta-dependency with little to no reliable downside protection from traditional diversifiers unless the macro call ends up being right. Will the next equity risk-off move stem from inflation, causing bonds to fail and trend to deliver? Or will it stem from growth slowing, causing bonds to deliver and trend to fail? Or, and more importantly, is there a diversifying option that wouldn’t force investors to have to make any call?
Against this challenging backdrop, investors would be wise to seek diversification and enhanced total return using low-beta alternative strategies. Low-beta alternatives often demonstrate more consistent return profiles, thereby offering the potential to participate in up markets and protect in down markets independent of the macro backdrop, the profile expected of an effective diversifier. Embracing low-beta alternatives can solve the diversification dilemma, arming portfolios with a more resilient shield against market volatility and ensure a steadier course through both bull and bear markets.