Chart of the week

DJIA has soared, but challenges remain

The DJIA just completed its fastest 1,000 point gain ever

January 19, 2018 | 1 minute read
Chart showing DJIA took 8 days to climb from 25,000 to 26,000
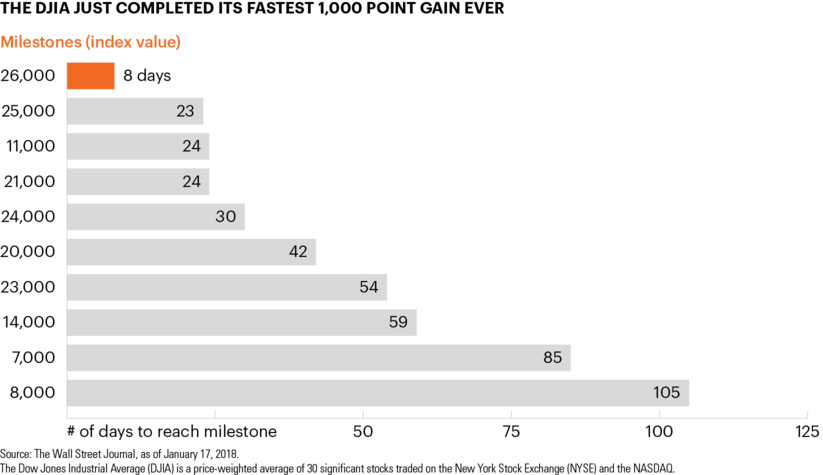
  • U.S. stock indexes reached new highs again this week, with the Dow Jones Industrial Average climbing above 26,000 before experiencing some selling pressure later in the week. The index’s recent thousand-point climb from 25,000 to 26,000 was, by far, its fastest ever, outpacing its second-fastest such rise by more than two weeks.1
  • Investors have enthusiastically helped propel stock prices higher, with stock funds worldwide seeing their sixth-largest weekly inflow ever in mid-January.2 For its part, the financial press has described recent market activity as a “melt-up rally” and noted that the “few remaining bears are finally giving up.”2,3
  • While investors remain enthusiastic about the economy and the equity markets, it’s important to remember that certain investment challenges remain in place.
  • For one, finding income continues to be difficult. The yield on the 10-year U.S. Treasury note was approximately 2.64% on Friday.4 This week it rose slightly above the band inside which it has traded since early 2017, yet it’s still very low relative to its post-crisis high of 3.98% in April 2010.4 Meanwhile, yields on investment grade bonds sit at approximately just 3.4%.5
  • Additionally, the recent run within the equity markets has come amid historically low levels of volatility. While no one knows what the future holds for stock market performance, investors might be wise to watch market conditions should volatility once again enter the markets from such potential sources as Fed policy, consumer demand and employment trends.

The chart of the week and any accompanying data is for informational purposes only and shall not be considered an investment recommendation or promotion of FS Investments or any FS Investments fund. The chart of the week is subject to change at any time based on market or other conditions, and FS Investments and FS Investment Solutions, LLC disclaim any responsibility to update such market commentary. The chart of the week should not be relied on as investment advice, and because investment decisions for the FS Investments funds are based on numerous factors, may not be relied on as an indication of the investment intent of any FS Investments fund. None of FS Investments, its funds, FS Investment Solutions, LLC or their respective affiliates can be held responsible for any direct or incidental loss incurred as a result of any reliance on the chart of the week or other opinions expressed therein. Any discussion of past performance should not be used as an indicator of future results.

This information is educational in nature and does not constitute a financial promotion, investment advice or an inducement or incitement to participate in any product, offering or investment. FS Investments is not adopting, making a recommendation for or endorsing any investment strategy or particular security. All views, opinions and positions expressed herein are that of the author and do not necessarily reflect the views, opinions or positions of FS Investments. All opinions are subject to change without notice, and you should always obtain current information and perform due diligence before participating in any investment. FS Investments does not provide legal or tax advice and the information herein should not be considered legal or tax advice. Tax laws and regulations are complex and subject to change, which can materially impact any investment result. FS Investments cannot guarantee that the information herein is accurate, complete, or timely. FS Investments makes no warranties with regard to such information or results obtained by its use, and disclaims any liability arising out of your use of, or any tax position taken in reliance on, such information.

Any projections, forecasts and estimates contained herein are based upon certain assumptions that the author considers reasonable. Projections are necessarily speculative in nature, and it can be expected that some or all of the assumptions underlying the projections will not materialize or will vary significantly from actual results. The inclusion of projections herein should not be regarded as a representation or guarantee regarding the reliability, accuracy or completeness of the information contained herein, and neither FS Investments nor the author are under any obligation to update or keep current such information.

All investing is subject to risk, including the possible loss of the money you invest.

Search our site