Short-term Treasury yields surpass equity yields, but remain low
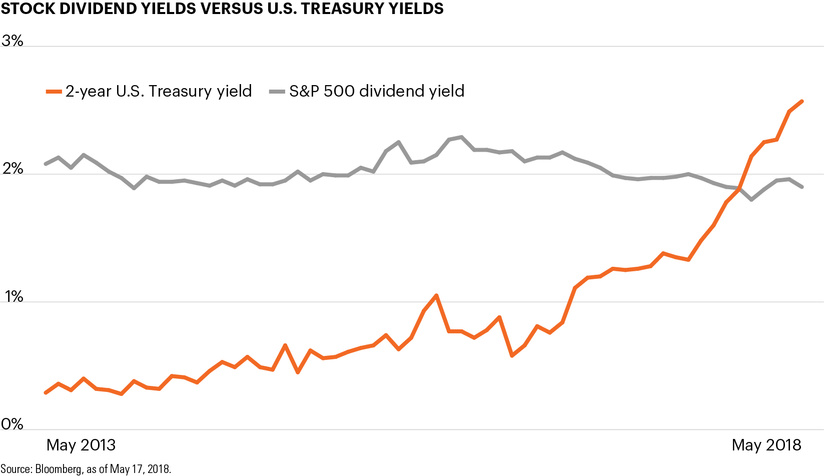
Stock dividend yields versus U.S. Treasury yields
May 18, 2018 | 1 minute read
U.S. equities have been attractive through the current economic recovery not only for their long-term total return potential, but also because they provided a significant yield advantage to shorter-dated 2-year U.S. Treasuries.1,2
While U.S. interest rates have been generally anchored at or near historic lows since 2009, the S&P 500 Index’s dividend yield, at approximately 2% over the past five years, was generous by comparison.
However, interest rates across the yield curve have risen considerably over the past year, and the S&P 500 Index lost its yield advantage over 2-year U.S. Treasuries in January.3 In fact, 2-year U.S. Treasuries currently yield approximately 67 bps more than the S&P 500 Index.3
Despite the yield differential tilting toward short-term Treasuries, interest rates remain very low from a historical perspective. Investors could continue to face challenges finding income in the coming years as the Fed’s current tightening path remains significantly slower and shallower than for any other hiking cycles in the past approximately 30 years.4
Looking forward, investors may continue to contend with an environment in which sources of growth and income remain at a premium, particularly as the current expansion continues to age.