Chart of the week

Has corporate revenue growth reached its peak?

See why revenue growth forecasts for the rest of 2018 show a pronounced decline despite a strong projection for Q2.

August 17, 2018 | 1 minute read
Current and projected S&P 500 revenue growth
  • The U.S. economy demonstrated its continued strength this week as retail sales data for July came in well above economists’ expectations and showed solid annual growth.1
  • Corporate earnings reports this year have reflected the healthy economic conditions. For example, Q2 2018 marked the second consecutive quarter of 20%-plus earnings growth and the third consecutive quarter of double-digit earnings growth.2
  • Yet some analysts believe that Q2 earnings may represent a peak in the current cycle and are more restrained about the prospects for corporate earnings, and economic prospects, in the coming quarters.3
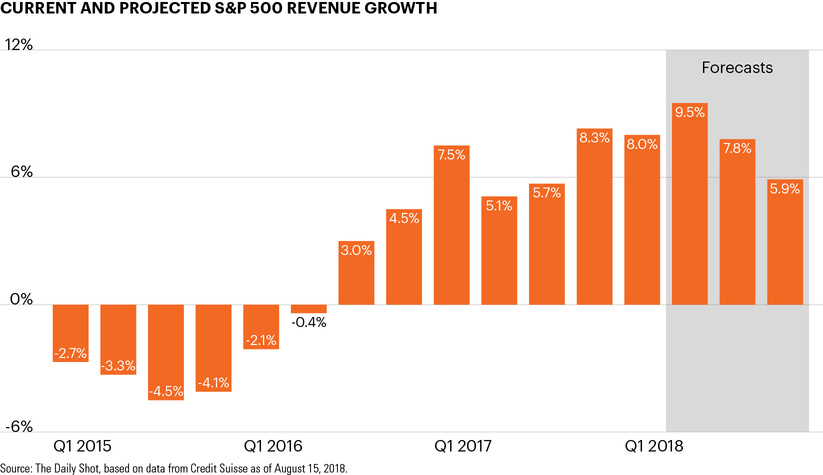
  • As the chart shows, forecasts for revenue growth, a key component of corporate earnings, of S&P 500 companies show a gradual deceleration in the second half of 2018, from 9.5% in Q2 to just 5.9% in Q4.4 Likewise, the University of Michigan’s measure of current economic conditions sits far above a similar measure of consumer expectations.5
  • As we noted last week, many of the drivers behind the current, long-running bull market – accommodative central bank policy, ultralow Treasury yields, limited volatility and strong economic tailwinds among them – appear to be shifting. Changing market or economic environments often lead to heightened market volatility as investors adjust to a new environment.

The chart of the week and any accompanying data is for informational purposes only and shall not be considered an investment recommendation or promotion of FS Investments or any FS Investments fund. The chart of the week is subject to change at any time based on market or other conditions, and FS Investments and FS Investment Solutions, LLC disclaim any responsibility to update such market commentary. The chart of the week should not be relied on as investment advice, and because investment decisions for the FS Investments funds are based on numerous factors, may not be relied on as an indication of the investment intent of any FS Investments fund. None of FS Investments, its funds, FS Investment Solutions, LLC or their respective affiliates can be held responsible for any direct or incidental loss incurred as a result of any reliance on the chart of the week or other opinions expressed therein. Any discussion of past performance should not be used as an indicator of future results.

This information is educational in nature and does not constitute a financial promotion, investment advice or an inducement or incitement to participate in any product, offering or investment. FS Investments is not adopting, making a recommendation for or endorsing any investment strategy or particular security. All views, opinions and positions expressed herein are that of the author and do not necessarily reflect the views, opinions or positions of FS Investments. All opinions are subject to change without notice, and you should always obtain current information and perform due diligence before participating in any investment. FS Investments does not provide legal or tax advice and the information herein should not be considered legal or tax advice. Tax laws and regulations are complex and subject to change, which can materially impact any investment result. FS Investments cannot guarantee that the information herein is accurate, complete, or timely. FS Investments makes no warranties with regard to such information or results obtained by its use, and disclaims any liability arising out of your use of, or any tax position taken in reliance on, such information.

Any projections, forecasts and estimates contained herein are based upon certain assumptions that the author considers reasonable. Projections are necessarily speculative in nature, and it can be expected that some or all of the assumptions underlying the projections will not materialize or will vary significantly from actual results. The inclusion of projections herein should not be regarded as a representation or guarantee regarding the reliability, accuracy or completeness of the information contained herein, and neither FS Investments nor the author are under any obligation to update or keep current such information.

All investing is subject to risk, including the possible loss of the money you invest.

Search our site