Chart of the week

When will volatility revert to its long-term average?

See how recent market volatility compares to its long-term average and what could drive it higher.

August 24, 2018 | 1 minute read
Negative monthly stock returns by year
  • Despite many potential headwinds, equity markets have remained relatively calm in 2018 while generating a year-to-date return of 8.3%.1
  • The CBOE Volatility Index (VIX), which measures investor expectations of near-term volatility, spiked in late January over fears that a rapid rise in interest rates might derail the long-running bull market.2 This concern contributed to a U.S. equity decline in both February and March.1
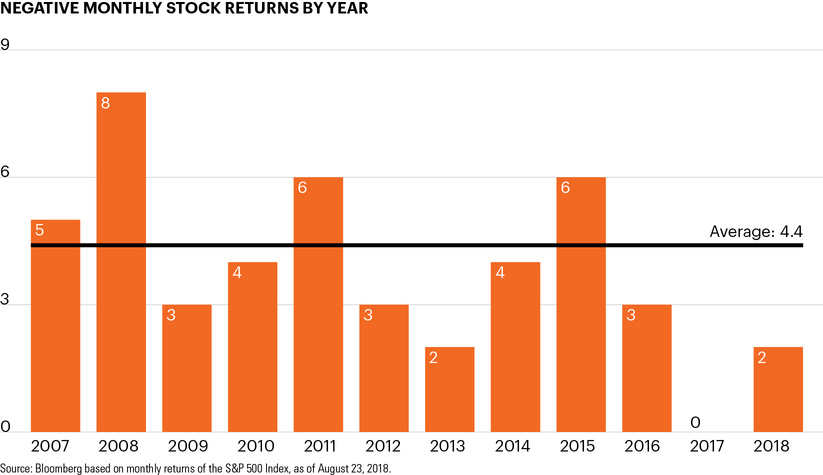
  • Since then, however, the VIX has been on a gradual downtrend. In 2017, it averaged just 11.1.2 It has stepped up to 15.5 year to date, but both figures are well below its long-term average of approximately 20.7.2
  • The chart highlights the general disparity in volatility today compared to the longer-term market environment. In the period since January 2017, for example, U.S. equities experienced just two monthly market declines (in Q1 2018) compared to an average 4.4 monthly declines per year in the 10-year period from 2007 through 2016.1
  • Corporate earnings and economic conditions remain strong, which could help further extend the market’s momentum. As the recently released minutes to the Fed’s July-August meeting highlighted, however, prolonged trade disputes remain among several sources of potential uncertainty and risk.3
  • Given the current atmosphere, investors may consider preparing for a more traditional level of volatility before it emerges.

  • S&P 500 Index, as of August 23, 2018.

  • Bloomberg, as of August 23, 2018.

  • Federal Reserve, https://bit.ly/2OZ4wMX.

The chart of the week and any accompanying data is for informational purposes only and shall not be considered an investment recommendation or promotion of FS Investments or any FS Investments fund. The chart of the week is subject to change at any time based on market or other conditions, and FS Investments and FS Investment Solutions, LLC disclaim any responsibility to update such market commentary. The chart of the week should not be relied on as investment advice, and because investment decisions for the FS Investments funds are based on numerous factors, may not be relied on as an indication of the investment intent of any FS Investments fund. None of FS Investments, its funds, FS Investment Solutions, LLC or their respective affiliates can be held responsible for any direct or incidental loss incurred as a result of any reliance on the chart of the week or other opinions expressed therein. Any discussion of past performance should not be used as an indicator of future results.

This information is educational in nature and does not constitute a financial promotion, investment advice or an inducement or incitement to participate in any product, offering or investment. FS Investments is not adopting, making a recommendation for or endorsing any investment strategy or particular security. All views, opinions and positions expressed herein are that of the author and do not necessarily reflect the views, opinions or positions of FS Investments. All opinions are subject to change without notice, and you should always obtain current information and perform due diligence before participating in any investment. FS Investments does not provide legal or tax advice and the information herein should not be considered legal or tax advice. Tax laws and regulations are complex and subject to change, which can materially impact any investment result. FS Investments cannot guarantee that the information herein is accurate, complete, or timely. FS Investments makes no warranties with regard to such information or results obtained by its use, and disclaims any liability arising out of your use of, or any tax position taken in reliance on, such information.

Any projections, forecasts and estimates contained herein are based upon certain assumptions that the author considers reasonable. Projections are necessarily speculative in nature, and it can be expected that some or all of the assumptions underlying the projections will not materialize or will vary significantly from actual results. The inclusion of projections herein should not be regarded as a representation or guarantee regarding the reliability, accuracy or completeness of the information contained herein, and neither FS Investments nor the author are under any obligation to update or keep current such information.

All investing is subject to risk, including the possible loss of the money you invest.

Search our site