Chart of the week

Traditional fixed income performance fades as rates rise

Investment grade and corporate bonds are negative as interest rates steadily rise. See which fixed income assets are bucking this trend.

October 5, 2018 | 1 minute read
Performance across major fixed income asset classes
  • 10-year U.S. Treasury yields briefly jumped above 3.2% this week, reaching a 7-year high as investors digest a new round of strong U.S. economic data.1 Year to date, the 10-year Treasury yield has risen approximately 80 bps compared to a decline of approximately 64 bps in the same time frame last year.1
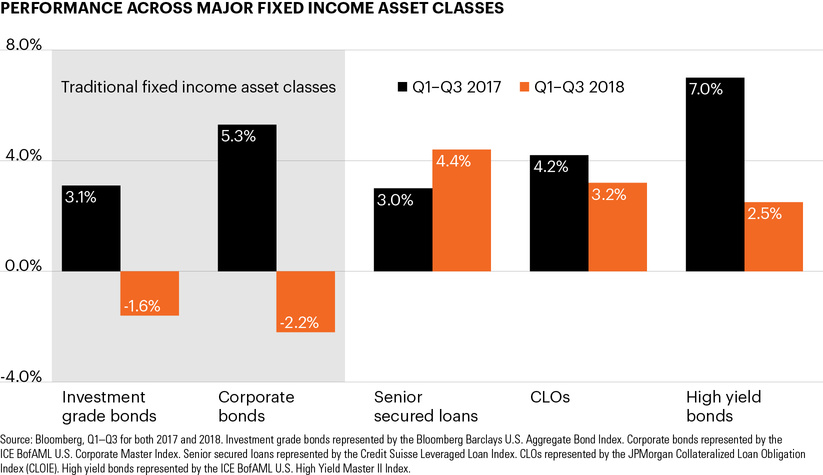
  • Traditional fixed income asset classes have fallen as rates have climbed since January. As the chart shows, investment grade and corporate bonds have posted negative YTD returns and are far below their YTD performances in 2017.2 Despite the recent spike, interest rates still remain low from a historical perspective.
  • Low-duration assets, such as senior secured loans, high yield bonds and CLOs, which are less sensitive to interest rate movements than their investment grade peers, have all generated positive YTD returns.2
  • Notably, senior secured loans are the only asset class whose YTD performance has exceeded its 2017 performance through the same period.2 Senior secured loans have drawn significant investor inflows in 2018, generally benefiting from their floating rate coupon and position as a potential hedge against rising interest rates this year.
  • Within a rising rate environment, investing in a broad range of fixed income asset classes with varying sensitivities to changes in interest rates may help diversify a traditional fixed income portfolio while also providing a competitive level of income.

  • Federal Reserve Bank of St. Louis, https://bit.ly/29ecBfp.

  • Bloomberg, Q1–Q3 for both 2017 and 2018. Investment grade bonds represented by the Bloomberg Barclays U.S. Aggregate Bond Index. Corporate bonds represented by the ICE BofAML U.S. Corporate Master Index. Senior secured loans represented by the Credit Suisse Leveraged Loan Index. CLOs represented by the JPMorgan CLOIE. High yield bonds represented by the ICE BofAML U.S. High Yield Master II Index.

The chart of the week and any accompanying data is for informational purposes only and shall not be considered an investment recommendation or promotion of FS Investments or any FS Investments fund. The chart of the week is subject to change at any time based on market or other conditions, and FS Investments and FS Investment Solutions, LLC disclaim any responsibility to update such market commentary. The chart of the week should not be relied on as investment advice, and because investment decisions for the FS Investments funds are based on numerous factors, may not be relied on as an indication of the investment intent of any FS Investments fund. None of FS Investments, its funds, FS Investment Solutions, LLC or their respective affiliates can be held responsible for any direct or incidental loss incurred as a result of any reliance on the chart of the week or other opinions expressed therein. Any discussion of past performance should not be used as an indicator of future results.

This information is educational in nature and does not constitute a financial promotion, investment advice or an inducement or incitement to participate in any product, offering or investment. FS Investments is not adopting, making a recommendation for or endorsing any investment strategy or particular security. All views, opinions and positions expressed herein are that of the author and do not necessarily reflect the views, opinions or positions of FS Investments. All opinions are subject to change without notice, and you should always obtain current information and perform due diligence before participating in any investment. FS Investments does not provide legal or tax advice and the information herein should not be considered legal or tax advice. Tax laws and regulations are complex and subject to change, which can materially impact any investment result. FS Investments cannot guarantee that the information herein is accurate, complete, or timely. FS Investments makes no warranties with regard to such information or results obtained by its use, and disclaims any liability arising out of your use of, or any tax position taken in reliance on, such information.

Any projections, forecasts and estimates contained herein are based upon certain assumptions that the author considers reasonable. Projections are necessarily speculative in nature, and it can be expected that some or all of the assumptions underlying the projections will not materialize or will vary significantly from actual results. The inclusion of projections herein should not be regarded as a representation or guarantee regarding the reliability, accuracy or completeness of the information contained herein, and neither FS Investments nor the author are under any obligation to update or keep current such information.

All investing is subject to risk, including the possible loss of the money you invest.

Search our site