Chart of the week

Traditional assets are struggling in 2018

See why increased volatility and minimal returns across domestic and global markets could continue through the year end.

October 26, 2018 | 1 minute read
In 2018, volatility is higher and returns are lower
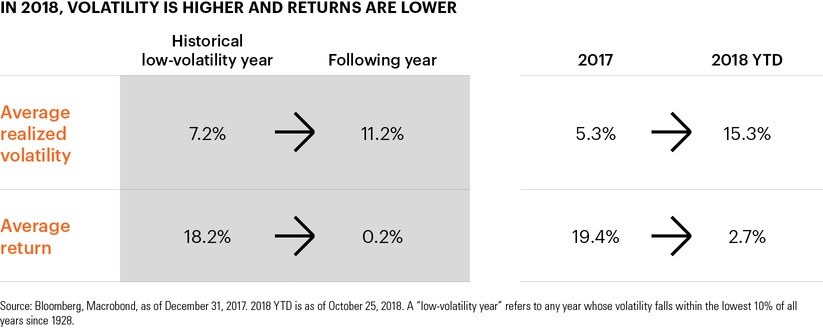
  • Market performance in October highlights a larger trend that investors have been seeing throughout 2018. Specifically, traditional equity market indexes have generated relatively low returns YTD while volatility has increased compared to 2017.
  • As we noted in June, this has historically occurred the year following a “low-volatility year.”1 After returning nearly 20% last year, the S&P 500 Index has returned just 2.7% YTD. Meanwhile, realized volatility has nearly tripled, from just 5.3% in 2017 to 15.3% in 2018.2
  • Notably, investors have not been able to turn to other major markets to generate higher returns. Small-cap U.S. stocks have declined 1.3% while international stocks have fallen more than 10%.3
  • Traditional fixed income markets have also faced challenges this year. The Bloomberg Barclays U.S. Aggregate Bond Index is down over 2% year to date as traditional safe-haven investments, such as Treasuries and investment grade corporate bonds, have underperformed shorter-duration investments.
  • Recent volatility has been driven by investors focused on the possibility that global economic growth could dampen in 2019, corporate earnings growth may soften or geopolitical concerns could become further aggravated.
  • Against this backdrop, investors may be well served preparing for the potential for a more muted return environment compared to recent years, coupled with periods of heightened volatility.

  • A “low-volatility year” refers to any year whose volatility falls within the lowest 10% of all years since 1928.

  • Bloomberg, Macrobond as of October 25, 2018.

  • Bloomberg, YTD as of October 25, 2018. Small-cap stocks are represented by the Russell 2000 Index. International stocks are represented by the MSCI EAFE Index.

The chart of the week and any accompanying data is for informational purposes only and shall not be considered an investment recommendation or promotion of FS Investments or any FS Investments fund. The chart of the week is subject to change at any time based on market or other conditions, and FS Investments and FS Investment Solutions, LLC disclaim any responsibility to update such market commentary. The chart of the week should not be relied on as investment advice, and because investment decisions for the FS Investments funds are based on numerous factors, may not be relied on as an indication of the investment intent of any FS Investments fund. None of FS Investments, its funds, FS Investment Solutions, LLC or their respective affiliates can be held responsible for any direct or incidental loss incurred as a result of any reliance on the chart of the week or other opinions expressed therein. Any discussion of past performance should not be used as an indicator of future results.

This information is educational in nature and does not constitute a financial promotion, investment advice or an inducement or incitement to participate in any product, offering or investment. FS Investments is not adopting, making a recommendation for or endorsing any investment strategy or particular security. All views, opinions and positions expressed herein are that of the author and do not necessarily reflect the views, opinions or positions of FS Investments. All opinions are subject to change without notice, and you should always obtain current information and perform due diligence before participating in any investment. FS Investments does not provide legal or tax advice and the information herein should not be considered legal or tax advice. Tax laws and regulations are complex and subject to change, which can materially impact any investment result. FS Investments cannot guarantee that the information herein is accurate, complete, or timely. FS Investments makes no warranties with regard to such information or results obtained by its use, and disclaims any liability arising out of your use of, or any tax position taken in reliance on, such information.

Any projections, forecasts and estimates contained herein are based upon certain assumptions that the author considers reasonable. Projections are necessarily speculative in nature, and it can be expected that some or all of the assumptions underlying the projections will not materialize or will vary significantly from actual results. The inclusion of projections herein should not be regarded as a representation or guarantee regarding the reliability, accuracy or completeness of the information contained herein, and neither FS Investments nor the author are under any obligation to update or keep current such information.

All investing is subject to risk, including the possible loss of the money you invest.

Search our site