Chart of the week

2018’s heightened volatility intensifies in October

See what’s behind recent market volatility and why investors may be wise to prepare for more in the months ahead.

November 9, 2018 | 1 minute read
S&P 500 Index daily price moves
  • The first weeks of Q4 have been marked by sharp moves in the U.S. equity market. Investors have become concerned about several high-profile, underwhelming earnings reports, rising interest rates and the potential for a global economic slowdown next year. In October alone, the S&P 500 Index declined nearly 7% before recovering some ground this month.
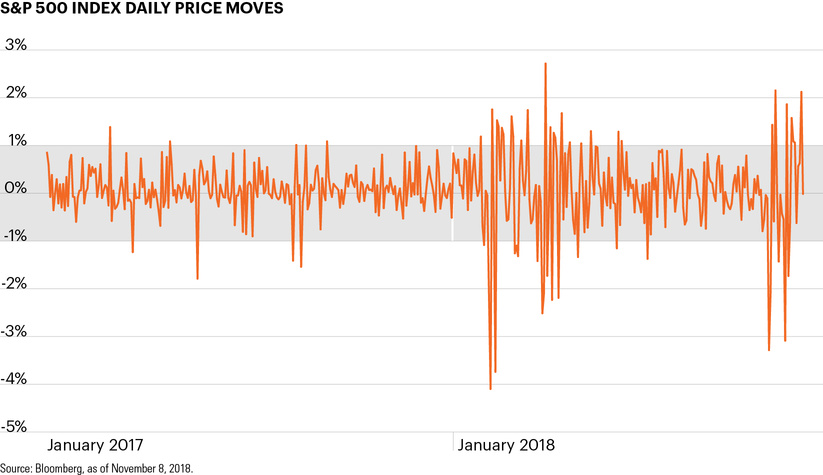
  • While October stands out for the degree of volatility investors endured, it reflects a heightened level of volatility markets have seen through much of 2018. This year’s market activity contrasts notably with the relatively placid environment investors experienced last year.
  • Consider that, in 2017, the S&P 500 Index rose more than 21% and experienced just 8 days in which it moved by 1% or more.1 Year to date, the index has experienced similar moves on 48 occasions and has generated a significantly smaller total return of just 6.7%.1
  • We have noted before that periods of low returns and high volatility have historically followed “low volatility” years, as 2017 was. Investors may be wise to prepare for additional volatility ahead as many of the underlying factors that have driven some of the largest market moves this year remain in place.

  • Bloomberg, as of November 8, 2018.

The chart of the week and any accompanying data is for informational purposes only and shall not be considered an investment recommendation or promotion of FS Investments or any FS Investments fund. The chart of the week is subject to change at any time based on market or other conditions, and FS Investments and FS Investment Solutions, LLC disclaim any responsibility to update such market commentary. The chart of the week should not be relied on as investment advice, and because investment decisions for the FS Investments funds are based on numerous factors, may not be relied on as an indication of the investment intent of any FS Investments fund. None of FS Investments, its funds, FS Investment Solutions, LLC or their respective affiliates can be held responsible for any direct or incidental loss incurred as a result of any reliance on the chart of the week or other opinions expressed therein. Any discussion of past performance should not be used as an indicator of future results.

This information is educational in nature and does not constitute a financial promotion, investment advice or an inducement or incitement to participate in any product, offering or investment. FS Investments is not adopting, making a recommendation for or endorsing any investment strategy or particular security. All views, opinions and positions expressed herein are that of the author and do not necessarily reflect the views, opinions or positions of FS Investments. All opinions are subject to change without notice, and you should always obtain current information and perform due diligence before participating in any investment. FS Investments does not provide legal or tax advice and the information herein should not be considered legal or tax advice. Tax laws and regulations are complex and subject to change, which can materially impact any investment result. FS Investments cannot guarantee that the information herein is accurate, complete, or timely. FS Investments makes no warranties with regard to such information or results obtained by its use, and disclaims any liability arising out of your use of, or any tax position taken in reliance on, such information.

Any projections, forecasts and estimates contained herein are based upon certain assumptions that the author considers reasonable. Projections are necessarily speculative in nature, and it can be expected that some or all of the assumptions underlying the projections will not materialize or will vary significantly from actual results. The inclusion of projections herein should not be regarded as a representation or guarantee regarding the reliability, accuracy or completeness of the information contained herein, and neither FS Investments nor the author are under any obligation to update or keep current such information.

All investing is subject to risk, including the possible loss of the money you invest.

Search our site