Chart of the week

Yields rise in 2018, but remain low across traditional assets

See how yields on traditional and non-traditional asset classes compare as interest rates remain low.

December 14, 2018 | 1 minute read
Yields across asset classes - Dec. 2017 vs. Dec. 2018
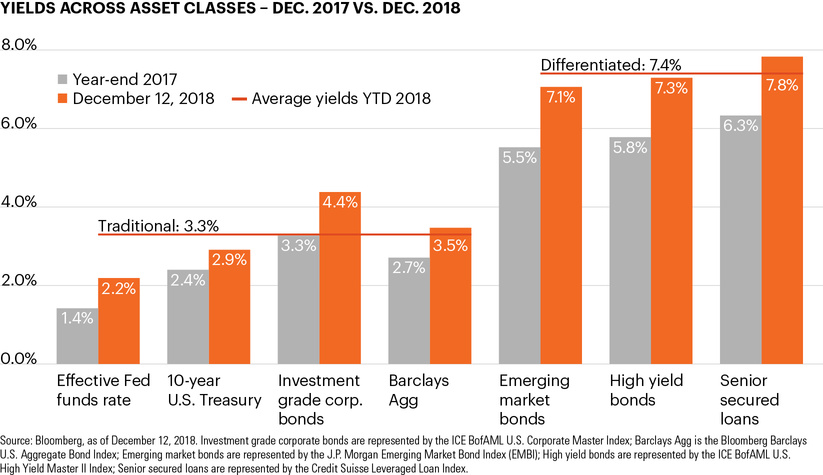
  • Following eight Fed rate hikes (so far) during the current cycle, and with unemployment in the U.S. at a multidecade low, yields across major fixed income asset classes have indeed moved up in 2018.1
  • The yield on the 10-year U.S. Treasury note, for example, is approximately 2.91% today versus just 2.40% in December 2017. The Bloomberg Barclays U.S. Aggregate Bond Index, the benchmark for a traditional fixed income portfolio, currently yields approximately 3.47% compared to 2.71% at year-end 2017.2
  • However, the significant interest rate moves that some investors have been waiting on for the past several years have yet to materialize. In August, for example, Goldman Sachs lowered its forecast for 10-year U.S. Treasury yields in December 2018 from 3.25% to 3.10% – which is still nearly 20 bps above its current yield.3
  • As 2018 comes to a close, we remain in what has been a multiyear low-rate environment for traditional fixed income assets.

  • Bureau of Labor Statistics, https://bit.ly/2ibnFLh.

  • Bloomberg, as of December 12, 2018. Investment grade corporate bonds are represented by the ICE BofAML U.S. Corporate Master Index; Emerging market bonds are represented by the J.P. Morgan EMBI; High yield bonds are represented by the ICE BofAML U.S. High Yield Master II Index; Senior secured loans are represented by the Credit Suisse Leveraged Loan Index.

  • Reuters, https://reut.rs/2QrYxWm.

The chart of the week and any accompanying data is for informational purposes only and shall not be considered an investment recommendation or promotion of FS Investments or any FS Investments fund. The chart of the week is subject to change at any time based on market or other conditions, and FS Investments and FS Investment Solutions, LLC disclaim any responsibility to update such market commentary. The chart of the week should not be relied on as investment advice, and because investment decisions for the FS Investments funds are based on numerous factors, may not be relied on as an indication of the investment intent of any FS Investments fund. None of FS Investments, its funds, FS Investment Solutions, LLC or their respective affiliates can be held responsible for any direct or incidental loss incurred as a result of any reliance on the chart of the week or other opinions expressed therein. Any discussion of past performance should not be used as an indicator of future results.

This information is educational in nature and does not constitute a financial promotion, investment advice or an inducement or incitement to participate in any product, offering or investment. FS Investments is not adopting, making a recommendation for or endorsing any investment strategy or particular security. All views, opinions and positions expressed herein are that of the author and do not necessarily reflect the views, opinions or positions of FS Investments. All opinions are subject to change without notice, and you should always obtain current information and perform due diligence before participating in any investment. FS Investments does not provide legal or tax advice and the information herein should not be considered legal or tax advice. Tax laws and regulations are complex and subject to change, which can materially impact any investment result. FS Investments cannot guarantee that the information herein is accurate, complete, or timely. FS Investments makes no warranties with regard to such information or results obtained by its use, and disclaims any liability arising out of your use of, or any tax position taken in reliance on, such information.

Any projections, forecasts and estimates contained herein are based upon certain assumptions that the author considers reasonable. Projections are necessarily speculative in nature, and it can be expected that some or all of the assumptions underlying the projections will not materialize or will vary significantly from actual results. The inclusion of projections herein should not be regarded as a representation or guarantee regarding the reliability, accuracy or completeness of the information contained herein, and neither FS Investments nor the author are under any obligation to update or keep current such information.

All investing is subject to risk, including the possible loss of the money you invest.

Search our site