Chart of the week

Economic growth slows toward a sustainable pace?

This week’s chart explains why weaker-than-expected Q3 forecasts shouldn’t stoke recession fears, but may spur reconsideration of income and growth sources.

October 4, 2019 | 1 minute read
  • A fresh batch of weaker-than-expected economic releases this week reignited investors’ long-running recession fears and likely paved the way for a third rate cut at the Fed’s October meeting.
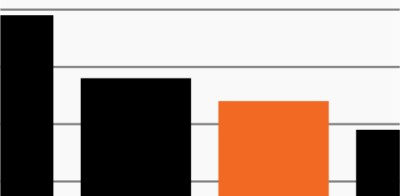
  • U.S. economic growth indeed slowed in Q2 and is expected to maintain its slow pace in Q3. The NY Fed’s Nowcast sees GDP growth of 2.1% for Q3 2019 while the Atlanta Fed’s GDPNow projects just 1.8%. Each of these two quarters would represent slower growth than in eight of the previous nine quarters.
  • Despite the recent slowdown, it’s important to keep in mind that GDP growth has spent most of the past two years running well above its long-term potential, fueled by tax cuts and fiscal stimulus measures.
  • According to researchers at the San Francisco Fed, the normal (long-term) pace for GDP growth today sits somewhere between 1.5% and 1.75% compared to 3% or higher from 1987–2007.1 They attribute the deceleration to a mix of slow labor force growth in the U.S. along with a significant decline in labor productivity.1
  • Against this backdrop, a move toward lower economic growth doesn’t necessarily represent a decline into recession. Instead, it could simply reflect economic growth settling into a slower but more sustainable growth rate. However, investors may still need to reconsider where they will find sources of income and growth within such an environment.

The chart of the week and any accompanying data is for informational purposes only and shall not be considered an investment recommendation or promotion of FS Investments or any FS Investments fund. The chart of the week is subject to change at any time based on market or other conditions, and FS Investments and FS Investment Solutions, LLC disclaim any responsibility to update such market commentary. The chart of the week should not be relied on as investment advice, and because investment decisions for the FS Investments funds are based on numerous factors, may not be relied on as an indication of the investment intent of any FS Investments fund. None of FS Investments, its funds, FS Investment Solutions, LLC or their respective affiliates can be held responsible for any direct or incidental loss incurred as a result of any reliance on the chart of the week or other opinions expressed therein. Any discussion of past performance should not be used as an indicator of future results.

This information is educational in nature and does not constitute a financial promotion, investment advice or an inducement or incitement to participate in any product, offering or investment. FS Investments is not adopting, making a recommendation for or endorsing any investment strategy or particular security. All views, opinions and positions expressed herein are that of the author and do not necessarily reflect the views, opinions or positions of FS Investments. All opinions are subject to change without notice, and you should always obtain current information and perform due diligence before participating in any investment. FS Investments does not provide legal or tax advice and the information herein should not be considered legal or tax advice. Tax laws and regulations are complex and subject to change, which can materially impact any investment result. FS Investments cannot guarantee that the information herein is accurate, complete, or timely. FS Investments makes no warranties with regard to such information or results obtained by its use, and disclaims any liability arising out of your use of, or any tax position taken in reliance on, such information.

Any projections, forecasts and estimates contained herein are based upon certain assumptions that the author considers reasonable. Projections are necessarily speculative in nature, and it can be expected that some or all of the assumptions underlying the projections will not materialize or will vary significantly from actual results. The inclusion of projections herein should not be regarded as a representation or guarantee regarding the reliability, accuracy or completeness of the information contained herein, and neither FS Investments nor the author are under any obligation to update or keep current such information.

All investing is subject to risk, including the possible loss of the money you invest.

Search our site