Chart of the week

Rates are set to remain lower for even longer after Fed cut

See why the Fed’s third interest rate cut this year and market expectations of a fourth by the end of 2020 create a bleak outlook for yield-hungry investors.

November 1, 2019 | 2 minute read
  • As expected, the FOMC cut interest rates at its meeting this week, citing weak global growth prospects and muted inflation pressures. The Fed has now cut interest rates three times since July, quickly reversing 75 bps of the 2.25% in rate hikes it had enacted in the earlier hiking cycle.
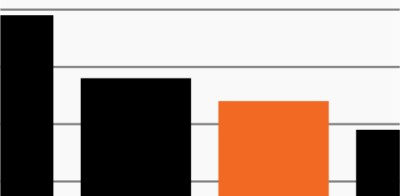
  • Even after this week’s rate cut, investors expect at least another cut by the end of next year. As the chart shows, investor expectations for the target Fed funds rate in December 2020 have gradually declined over the last year.1 In fact, markets are pricing in an additional 35 bps reduction between now and December 2020.1
  • The Fed’s accommodative approach has helped boost year-to-date returns of stocks (S&P 500 +23.3%) and bonds (Barclays Agg +8.9%).1
  • However, looking more closely at what has driven fixed income returns this year reveals a bleak outlook for yield-hungry investors. The vast majority of the Barclays Agg’s return has come from price appreciation thanks in large part to the latest round of Fed cuts.1 Meanwhile, income has represented an increasingly small fraction of the Barclays Agg’s total return since the 1990s and accounts for approximately just 2% of its nearly 9% YTD total return.1
  • With interest rates already near historic lows, fixed income investors may not be able to rely on falling rates to drive returns. Increasingly, investors may need to turn to alternative sources of income as the current lower-for-longer environment does not appear ready to recede anytime soon.

  • Bloomberg Finance, L.P., as of October 31, 2019. Market expectations of the Fed funds rate for December 2020.

The chart of the week and any accompanying data is for informational purposes only and shall not be considered an investment recommendation or promotion of FS Investments or any FS Investments fund. The chart of the week is subject to change at any time based on market or other conditions, and FS Investments and FS Investment Solutions, LLC disclaim any responsibility to update such market commentary. The chart of the week should not be relied on as investment advice, and because investment decisions for the FS Investments funds are based on numerous factors, may not be relied on as an indication of the investment intent of any FS Investments fund. None of FS Investments, its funds, FS Investment Solutions, LLC or their respective affiliates can be held responsible for any direct or incidental loss incurred as a result of any reliance on the chart of the week or other opinions expressed therein. Any discussion of past performance should not be used as an indicator of future results.

This information is educational in nature and does not constitute a financial promotion, investment advice or an inducement or incitement to participate in any product, offering or investment. FS Investments is not adopting, making a recommendation for or endorsing any investment strategy or particular security. All views, opinions and positions expressed herein are that of the author and do not necessarily reflect the views, opinions or positions of FS Investments. All opinions are subject to change without notice, and you should always obtain current information and perform due diligence before participating in any investment. FS Investments does not provide legal or tax advice and the information herein should not be considered legal or tax advice. Tax laws and regulations are complex and subject to change, which can materially impact any investment result. FS Investments cannot guarantee that the information herein is accurate, complete, or timely. FS Investments makes no warranties with regard to such information or results obtained by its use, and disclaims any liability arising out of your use of, or any tax position taken in reliance on, such information.

Any projections, forecasts and estimates contained herein are based upon certain assumptions that the author considers reasonable. Projections are necessarily speculative in nature, and it can be expected that some or all of the assumptions underlying the projections will not materialize or will vary significantly from actual results. The inclusion of projections herein should not be regarded as a representation or guarantee regarding the reliability, accuracy or completeness of the information contained herein, and neither FS Investments nor the author are under any obligation to update or keep current such information.

All investing is subject to risk, including the possible loss of the money you invest.

Search our site