Chart of the week

Are stocks pricing in too quick an economic rebound?

Overly optimistic? Our chart highlights stocks’ recovery vs. falling yields and oil prices – and what this could mean for investors.

April 24, 2020 | 1 minute read
  • On the heels of their fastest-ever plunge into a bear market, U.S. stocks have recovered nearly half of their earlier losses. Sentiment has rapidly turned optimistic as investors focus on the prospects of a gradual economic reopening combined with continued monetary and fiscal support leading to what they hope will be a V-shaped recovery.
  • The S&P 500 is now up approximately 26% since bottoming on March 23.
  • As sentiment and activity within the equity markets has turned decidedly more optimistic, however, other major asset classes, including those often viewed as economic bellwethers, paint a less confident picture.
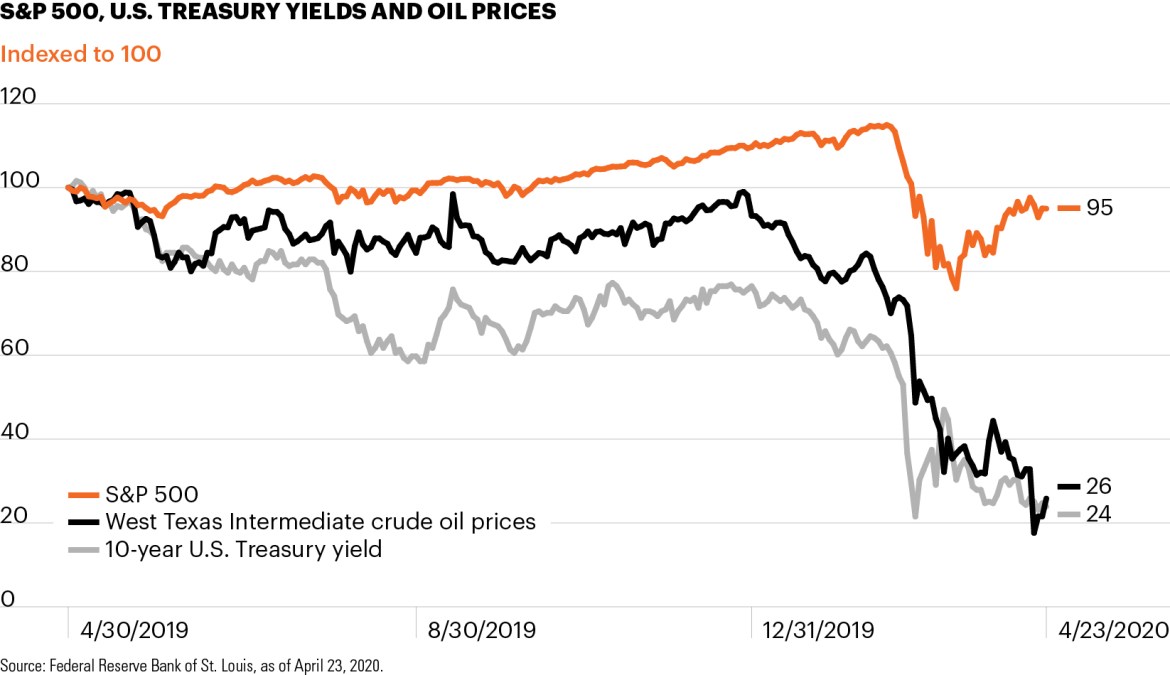
  • The chart compares the performance of the S&P 500 over the past year with changes in the 10-year Treasury yield and crude oil prices. All three markets experienced similar slides beginning in late February. While the S&P has since moved out of bear market territory, oil prices and Treasury yields have continued to slide, flashing caution signs about the prospects for a rapid economic recovery.
  • Markets are forward-looking and equity investors could be proven correct if economic indicators begin to bounce back in the coming months. Even under a best-case scenario, however, the U.S. economy appears to be headed for a contraction year. Against this backdrop, investors may be wise to prepare for the possibility that the eventual economic recovery will be choppier and slower than recent stock market activity may suggest.1

  • Federal Reserve Bank of St. Louis, as of April 23, 2020.

The chart of the week and any accompanying data is for informational purposes only and shall not be considered an investment recommendation or promotion of FS Investments or any FS Investments fund. The chart of the week is subject to change at any time based on market or other conditions, and FS Investments and FS Investment Solutions, LLC disclaim any responsibility to update such market commentary. The chart of the week should not be relied on as investment advice, and because investment decisions for the FS Investments funds are based on numerous factors, may not be relied on as an indication of the investment intent of any FS Investments fund. None of FS Investments, its funds, FS Investment Solutions, LLC or their respective affiliates can be held responsible for any direct or incidental loss incurred as a result of any reliance on the chart of the week or other opinions expressed therein. Any discussion of past performance should not be used as an indicator of future results.

This information is educational in nature and does not constitute a financial promotion, investment advice or an inducement or incitement to participate in any product, offering or investment. FS Investments is not adopting, making a recommendation for or endorsing any investment strategy or particular security. All views, opinions and positions expressed herein are that of the author and do not necessarily reflect the views, opinions or positions of FS Investments. All opinions are subject to change without notice, and you should always obtain current information and perform due diligence before participating in any investment. FS Investments does not provide legal or tax advice and the information herein should not be considered legal or tax advice. Tax laws and regulations are complex and subject to change, which can materially impact any investment result. FS Investments cannot guarantee that the information herein is accurate, complete, or timely. FS Investments makes no warranties with regard to such information or results obtained by its use, and disclaims any liability arising out of your use of, or any tax position taken in reliance on, such information.

Any projections, forecasts and estimates contained herein are based upon certain assumptions that the author considers reasonable. Projections are necessarily speculative in nature, and it can be expected that some or all of the assumptions underlying the projections will not materialize or will vary significantly from actual results. The inclusion of projections herein should not be regarded as a representation or guarantee regarding the reliability, accuracy or completeness of the information contained herein, and neither FS Investments nor the author are under any obligation to update or keep current such information.

All investing is subject to risk, including the possible loss of the money you invest.

Search our site