Chart of the week

Dueling data leaves market outlook open to interpretation

Economic data as a Rorschach test? Like the famous inkblots, competing good news-bad news releases make market outlooks appear highly subjective.

July 17, 2020 | 2 minute read
  • Market headlines this week underscored the type of dueling good news-bad news scenarios that investors have been wading through since the market recovery began.
  • The Citi Economic Surprise Index, which is a gauge of optimism about the economy, reached a record high again in July.1 Likewise, the NFIB Small Business Optimism Index released this week beat economists’ expectations and has now retraced all of its April and May declines.2
  • At the same time, however, the “Actual Earnings Changes” portion of the Small Business Optimism Index has been in a near freefall for the past three months.2 Among the largest corporations, Wall Street banks sounded notably pessimistic on their Q2 earnings calls this week. Three major lenders set aside $28 billion for bad loans in Q2, a quarterly mark surpassed only in Q4 2008.3
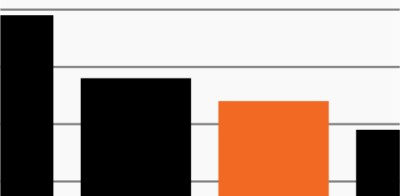
  • In the face of such competing, high-profile economic releases, investors may be excused for cherry-picking the data points they prefer. The chart highlights the market uncertainty such disparate data has created. It shows the results of a recent survey of investors’ expectations for the market over the next six months – every option, from “down 10%” to “up 10%” and everything in between, received about the same percentage of votes.4
  • Against this backdrop, investors may do well by planning for a range of possible market movements – participating in potential upside while also remaining prepared if markets take another step down. In either case, experienced, active management may be more important than ever in discerning the market’s next movement.

The chart of the week and any accompanying data is for informational purposes only and shall not be considered an investment recommendation or promotion of FS Investments or any FS Investments fund. The chart of the week is subject to change at any time based on market or other conditions, and FS Investments and FS Investment Solutions, LLC disclaim any responsibility to update such market commentary. The chart of the week should not be relied on as investment advice, and because investment decisions for the FS Investments funds are based on numerous factors, may not be relied on as an indication of the investment intent of any FS Investments fund. None of FS Investments, its funds, FS Investment Solutions, LLC or their respective affiliates can be held responsible for any direct or incidental loss incurred as a result of any reliance on the chart of the week or other opinions expressed therein. Any discussion of past performance should not be used as an indicator of future results.

This information is educational in nature and does not constitute a financial promotion, investment advice or an inducement or incitement to participate in any product, offering or investment. FS Investments is not adopting, making a recommendation for or endorsing any investment strategy or particular security. All views, opinions and positions expressed herein are that of the author and do not necessarily reflect the views, opinions or positions of FS Investments. All opinions are subject to change without notice, and you should always obtain current information and perform due diligence before participating in any investment. FS Investments does not provide legal or tax advice and the information herein should not be considered legal or tax advice. Tax laws and regulations are complex and subject to change, which can materially impact any investment result. FS Investments cannot guarantee that the information herein is accurate, complete, or timely. FS Investments makes no warranties with regard to such information or results obtained by its use, and disclaims any liability arising out of your use of, or any tax position taken in reliance on, such information.

Any projections, forecasts and estimates contained herein are based upon certain assumptions that the author considers reasonable. Projections are necessarily speculative in nature, and it can be expected that some or all of the assumptions underlying the projections will not materialize or will vary significantly from actual results. The inclusion of projections herein should not be regarded as a representation or guarantee regarding the reliability, accuracy or completeness of the information contained herein, and neither FS Investments nor the author are under any obligation to update or keep current such information.

All investing is subject to risk, including the possible loss of the money you invest.

Search our site