Chart of the week

A narrow rally reveals many stocks left behind

Investors got a taste of what markets may look like if tech turns south. Our chart looks at the uneven performance of S&P stocks over the past year.

September 11, 2020 | 2 minute read

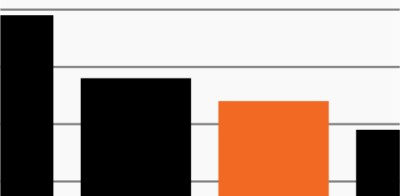
How far below their 52-week high are S&P 500 constituents?

Source: Bloomberg, as of September 10, 2020.

  • U.S. stocks have staged a powerful recovery in 2020, rising more than 50% off their March lows and turning in a YTD return of approximately 6.6%.1
  • Beneath the surface, however, the rally has been narrow and uneven. The largest technology stocks – also the largest constituents of the S&P 500 – are up approximately 85% from their lows while the median stock in the S&P remains in negative territory YTD.2
  • The chart highlights the limited nature of the S&P 500’s performance over the past year. Nearly all of the index’s constituents remain below their 52-week high.3 While 31% of S&P constituents are within 10% of their 52-week high, nearly half (44%) are off by 20% or more.3
  • Investors were reminded this week of the fragile nature of a recovery driven by a single sector, or even by the largest companies within that sector. The tech-heavy Nasdaq fell into correction territory within just three days last week, while the S&P 500 has fallen nearly 7% since September 2. Against this backdrop, investors may consider alternative sources of diversification to combat the concentration risk inherent in many traditional stock indexes today.

  • S&P 500 Index, as of September 10, 2020.

  • Technology stocks refer to the NYSE FANG+ Index, which provides exposure to 10 of the highest-traded technology companies. Data as of September 9, 2020.

  • Bloomberg, as of September 10, 2020.

The chart of the week and any accompanying data is for informational purposes only and shall not be considered an investment recommendation or promotion of FS Investments or any FS Investments fund. The chart of the week is subject to change at any time based on market or other conditions, and FS Investments and FS Investment Solutions, LLC disclaim any responsibility to update such market commentary. The chart of the week should not be relied on as investment advice, and because investment decisions for the FS Investments funds are based on numerous factors, may not be relied on as an indication of the investment intent of any FS Investments fund. None of FS Investments, its funds, FS Investment Solutions, LLC or their respective affiliates can be held responsible for any direct or incidental loss incurred as a result of any reliance on the chart of the week or other opinions expressed therein. Any discussion of past performance should not be used as an indicator of future results.

This information is educational in nature and does not constitute a financial promotion, investment advice or an inducement or incitement to participate in any product, offering or investment. FS Investments is not adopting, making a recommendation for or endorsing any investment strategy or particular security. All views, opinions and positions expressed herein are that of the author and do not necessarily reflect the views, opinions or positions of FS Investments. All opinions are subject to change without notice, and you should always obtain current information and perform due diligence before participating in any investment. FS Investments does not provide legal or tax advice and the information herein should not be considered legal or tax advice. Tax laws and regulations are complex and subject to change, which can materially impact any investment result. FS Investments cannot guarantee that the information herein is accurate, complete, or timely. FS Investments makes no warranties with regard to such information or results obtained by its use, and disclaims any liability arising out of your use of, or any tax position taken in reliance on, such information.

Any projections, forecasts and estimates contained herein are based upon certain assumptions that the author considers reasonable. Projections are necessarily speculative in nature, and it can be expected that some or all of the assumptions underlying the projections will not materialize or will vary significantly from actual results. The inclusion of projections herein should not be regarded as a representation or guarantee regarding the reliability, accuracy or completeness of the information contained herein, and neither FS Investments nor the author are under any obligation to update or keep current such information.

All investing is subject to risk, including the possible loss of the money you invest.

Search our site