Chart of the week

Chasm between stocks and sentiment grows wider

Market activity has been divorced from investor sentiment of late. Our chart looks at the mismatch and why investors might prepare for a pullback.

October 2, 2020 | 2 minute read

Stock performance and market sentiment

Source: American Association of Individual Investors (AAII) Investor Sentiment Survey, via Bloomberg Finance, L.P., as of September 24, 2020, latest data available. Investor sentiment represented by the 4-week moving average of percentage of bulls minus bears.

  • Despite a several-week pause in September, the S&P 500 recorded a strong gain of nearly 9% in Q3. Combining that return with an approximately 20% move higher in Q2, the S&P 500 turned in its best two-quarter performance since the second and third quarters of 2009.
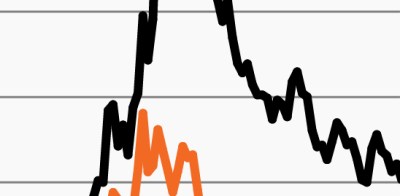
  • As the market has moved steadily higher through the past six months, however, it has grown increasingly divorced from investor sentiment.
  • The chart compares the performance of the S&P 500 with the AAII Investor Sentiment Survey, which measures individual investors’ expectations for the stock market in the next six months.1 As it highlights, stocks were pretty closely aligned with sentiment for much of 2018 and 2019. Beginning in March 2020, however, as the S&P began its strong recovery, performance began to decouple from sentiment. As investor sentiment has remained relatively bearish since May, the gap between the two has grown notably wider.
  • Predicting the market’s direction for the next week or month is always difficult. It’s fair to say, however, that something must give. Either stocks continue to rise and sentiment adjusts, or they hit another patch of volatility and again match investors’ more subdued expectations.
  • Given the considerable health, economic and political risks markets must contend with today, investors may be wise in seeking to prepare their portfolios for potential equity volatility ahead.

  • AAII Investor Sentiment Survey, via Bloomberg Finance, L.P., as of September 24, 2020. Bull/bear spread refers to the percentage of bulls minus bears.

The chart of the week and any accompanying data is for informational purposes only and shall not be considered an investment recommendation or promotion of FS Investments or any FS Investments fund. The chart of the week is subject to change at any time based on market or other conditions, and FS Investments and FS Investment Solutions, LLC disclaim any responsibility to update such market commentary. The chart of the week should not be relied on as investment advice, and because investment decisions for the FS Investments funds are based on numerous factors, may not be relied on as an indication of the investment intent of any FS Investments fund. None of FS Investments, its funds, FS Investment Solutions, LLC or their respective affiliates can be held responsible for any direct or incidental loss incurred as a result of any reliance on the chart of the week or other opinions expressed therein. Any discussion of past performance should not be used as an indicator of future results.

This information is educational in nature and does not constitute a financial promotion, investment advice or an inducement or incitement to participate in any product, offering or investment. FS Investments is not adopting, making a recommendation for or endorsing any investment strategy or particular security. All views, opinions and positions expressed herein are that of the author and do not necessarily reflect the views, opinions or positions of FS Investments. All opinions are subject to change without notice, and you should always obtain current information and perform due diligence before participating in any investment. FS Investments does not provide legal or tax advice and the information herein should not be considered legal or tax advice. Tax laws and regulations are complex and subject to change, which can materially impact any investment result. FS Investments cannot guarantee that the information herein is accurate, complete, or timely. FS Investments makes no warranties with regard to such information or results obtained by its use, and disclaims any liability arising out of your use of, or any tax position taken in reliance on, such information.

Any projections, forecasts and estimates contained herein are based upon certain assumptions that the author considers reasonable. Projections are necessarily speculative in nature, and it can be expected that some or all of the assumptions underlying the projections will not materialize or will vary significantly from actual results. The inclusion of projections herein should not be regarded as a representation or guarantee regarding the reliability, accuracy or completeness of the information contained herein, and neither FS Investments nor the author are under any obligation to update or keep current such information.

All investing is subject to risk, including the possible loss of the money you invest.

Search our site