Chart of the week

Election delivering a return to slow, low growth?

Stocks jumped this week, but rates’ decline points to an economic slog ahead. We look at what a slow recovery would mean for investors.

November 6, 2020 | 2 minute read

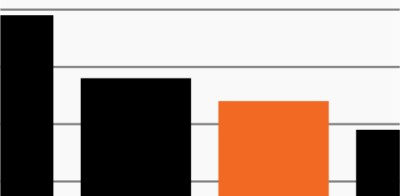
GDP recoveries, then and now (indexed to 100)

Source: Federal Reserve Bank of St. Louis, as of November 5, 2020. Chart shows the path of real GDP during the past two recessions: the Global Financial Crisis (Q1 2007–Q4 2010) and the current recession to date (Q3 2017–Q3 2020).

  • Investors’ initial reaction to what seems to be an increasingly probable outcome of the 2020 election – a divided government – has been very positive. Stocks were up more than 7% through Thursday while the Barclays Agg has risen nearly 1%, benefiting from rates’ steep decline.1
  • Despite the initial optimism, the swift reversal in rates – the 10-year U.S. Treasury fell back down to 0.77% from a recent peak of 0.90% – underscores the cloudier macro environment that seems likely to take shape in 2021. That is, the prospect of less fiscal stimulus points to the idea that the economic recovery could from here move into a more moderate phase. 
  • The chart compares real GDP growth during the recession in 2008–09 with today’s pandemic-driven recession and highlights their varying paths to recovery.2 For example, the recovery in the years following the Global Financial Crisis was a long, slow process, as GDP didn’t reach its pre-crisis peak until Q3 2010, a full 16 quarters later.2
  • The current recovery, of course, has taken a very different shape as it was initially fueled by massive amounts of monetary and fiscal stimulus. Looking ahead, however, a divided federal government could pose significant challenges to the next leg of the recovery.
  • Expectations for Q4 2020 GDP were on the decline through September and October, and J.P. Morgan analysts now expect Q4 2021 GDP growth of just 1.7% – approximately 4% below its pre-crisis path.3
  • Despite investors’ initial glee at the current election results, the Treasury curve may be viewed as a reminder of the potential economic slog still ahead of us. Against this backdrop, investors may find generating competitive income and total return opportunities across traditional asset classes a difficult proposition.  

  • Bloomberg Finance, L.P., as of November 5, 2020. Stock returns based on the S&P 500 Index.

  • Federal Reserve Bank of St. Louis, as of November 5, 2020. Chart shows the path of real GDP during the past two recessions: the Global Financial Crisis (Q1 2007–Q4 2010) and the current recession to date (Q3 2017–Q3 2020).

  • J.P. Morgan Economic Research Note, With wave following wave to the edge.

The chart of the week and any accompanying data is for informational purposes only and shall not be considered an investment recommendation or promotion of FS Investments or any FS Investments fund. The chart of the week is subject to change at any time based on market or other conditions, and FS Investments and FS Investment Solutions, LLC disclaim any responsibility to update such market commentary. The chart of the week should not be relied on as investment advice, and because investment decisions for the FS Investments funds are based on numerous factors, may not be relied on as an indication of the investment intent of any FS Investments fund. None of FS Investments, its funds, FS Investment Solutions, LLC or their respective affiliates can be held responsible for any direct or incidental loss incurred as a result of any reliance on the chart of the week or other opinions expressed therein. Any discussion of past performance should not be used as an indicator of future results.

This information is educational in nature and does not constitute a financial promotion, investment advice or an inducement or incitement to participate in any product, offering or investment. FS Investments is not adopting, making a recommendation for or endorsing any investment strategy or particular security. All views, opinions and positions expressed herein are that of the author and do not necessarily reflect the views, opinions or positions of FS Investments. All opinions are subject to change without notice, and you should always obtain current information and perform due diligence before participating in any investment. FS Investments does not provide legal or tax advice and the information herein should not be considered legal or tax advice. Tax laws and regulations are complex and subject to change, which can materially impact any investment result. FS Investments cannot guarantee that the information herein is accurate, complete, or timely. FS Investments makes no warranties with regard to such information or results obtained by its use, and disclaims any liability arising out of your use of, or any tax position taken in reliance on, such information.

Any projections, forecasts and estimates contained herein are based upon certain assumptions that the author considers reasonable. Projections are necessarily speculative in nature, and it can be expected that some or all of the assumptions underlying the projections will not materialize or will vary significantly from actual results. The inclusion of projections herein should not be regarded as a representation or guarantee regarding the reliability, accuracy or completeness of the information contained herein, and neither FS Investments nor the author are under any obligation to update or keep current such information.

All investing is subject to risk, including the possible loss of the money you invest.

Search our site