Chart of the week

Rates gyrate amid competing market drivers

Treasury yields see significant daily swings. This week’s chart looks at what they could be saying about the forward-looking investment environment.

March 4, 2022 | 3 minute read

Daily changes in 10-year U.S. Treasury yield

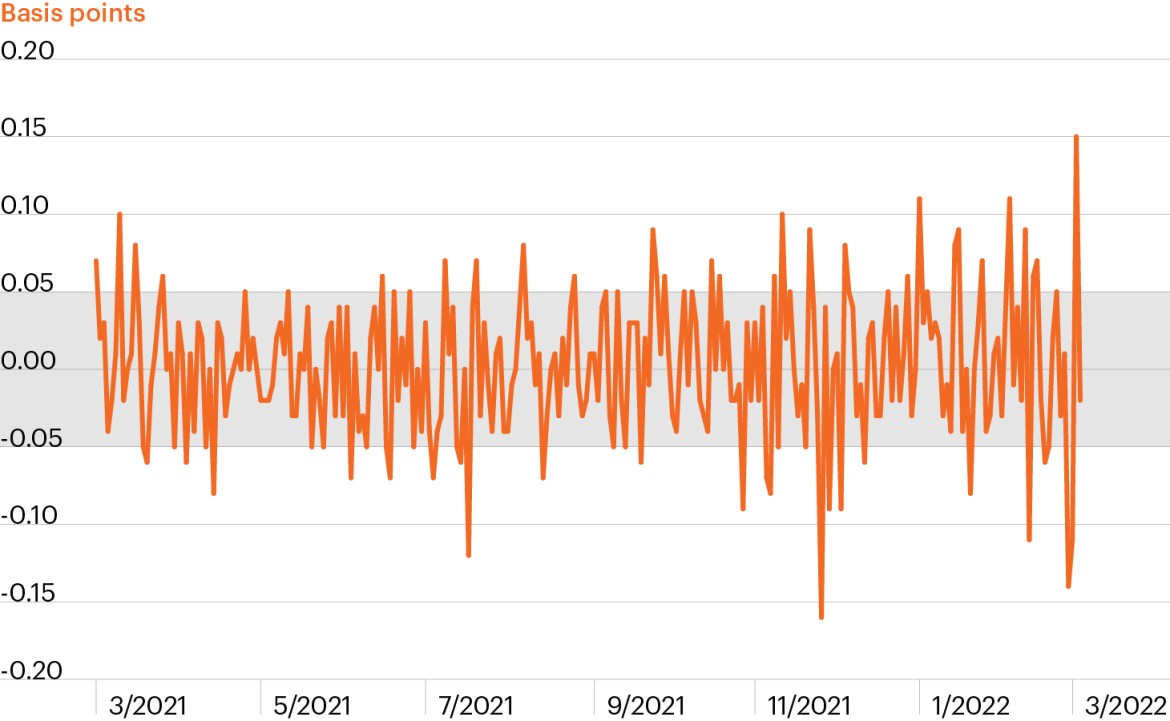
Source: Federal Reserve Bank of St. Louis, as of March 3, 2022.

  • The combination of increasingly intense fighting in Ukraine, growing Russian isolation and spiking commodity prices have added a new layer of volatility to an already choppy start to the year, driven by concerns of an overly hawkish Fed and multi-decade high inflation readings.
  • Treasury rates reflect the increased volatility as investors attempt to make sense of competing market drivers between massive headline risks (geopolitical risks in addition to supply chain challenges, evolving global central bank policy and inflation) and the continued resilience of the U.S. economy.
  • The 10-year U.S. Treasury saw relatively mild daily movement of 5 basis points or fewer for most of the past year. The 10-year’s fluctuations have been exaggerated this week, however, as it has moved 10+ basis points in three of the four trading days through Thursday.1
  • Investors often look to the 10-year as a proxy for economic expectations. It seems fair to say that today’s investment environment appears murkier than ever. Against this backdrop, investors may be wise to adopt an active approach to navigate quickly changing markets and seek alternative ways to generate returns and manage risk.

  • Federal Reserve Bank of St. Louis, as of March 3. Does not include Friday, March 4.

The chart of the week and any accompanying data is for informational purposes only and shall not be considered an investment recommendation or promotion of FS Investments or any FS Investments fund. The chart of the week is subject to change at any time based on market or other conditions, and FS Investments and FS Investment Solutions, LLC disclaim any responsibility to update such market commentary. The chart of the week should not be relied on as investment advice, and because investment decisions for the FS Investments funds are based on numerous factors, may not be relied on as an indication of the investment intent of any FS Investments fund. None of FS Investments, its funds, FS Investment Solutions, LLC or their respective affiliates can be held responsible for any direct or incidental loss incurred as a result of any reliance on the chart of the week or other opinions expressed therein. Any discussion of past performance should not be used as an indicator of future results.

This information is educational in nature and does not constitute a financial promotion, investment advice or an inducement or incitement to participate in any product, offering or investment. FS Investments is not adopting, making a recommendation for or endorsing any investment strategy or particular security. All views, opinions and positions expressed herein are that of the author and do not necessarily reflect the views, opinions or positions of FS Investments. All opinions are subject to change without notice, and you should always obtain current information and perform due diligence before participating in any investment. FS Investments does not provide legal or tax advice and the information herein should not be considered legal or tax advice. Tax laws and regulations are complex and subject to change, which can materially impact any investment result. FS Investments cannot guarantee that the information herein is accurate, complete, or timely. FS Investments makes no warranties with regard to such information or results obtained by its use, and disclaims any liability arising out of your use of, or any tax position taken in reliance on, such information.

Any projections, forecasts and estimates contained herein are based upon certain assumptions that the author considers reasonable. Projections are necessarily speculative in nature, and it can be expected that some or all of the assumptions underlying the projections will not materialize or will vary significantly from actual results. The inclusion of projections herein should not be regarded as a representation or guarantee regarding the reliability, accuracy or completeness of the information contained herein, and neither FS Investments nor the author are under any obligation to update or keep current such information.

All investing is subject to risk, including the possible loss of the money you invest.

Search our site