Chart of the week

Global fixed income falters amid sustained inflation

This week’s chart looks at the global rate environment, highlighting its impact on U.S. and global core fixed income returns.

June 10, 2022 | 2 minute read

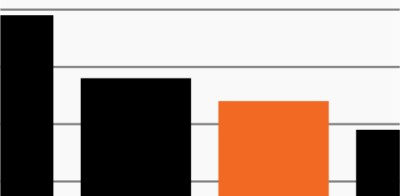
A global view: Interest rates and core fixed income

Source: Bloomberg Finance, L.P. and FS Investments, as of June 8, 2022. Chart shows the 10-year yield on each country’s government bond. Agg and Global Agg refer to the Bloomberg U.S. Aggregate Index and Bloomberg Global Aggregate Index.

  • The Federal Reserve recently ramped up its efforts at battling inflation, initiating quantitative tightening, whereby it began actively reducing assets on its balance sheet. Meanwhile this week, Treasury Secretary Yellen warned that the U.S. could face a prolonged period of elevated inflation.
  • The battle will soon turn global as European policymakers laid out plans to hike rates in July, which would be the first increase in more than a decade. The European Central Bank (ECB) also expects to end its large-scale bond buying program at the same time.
  • Amid the protracted inflationary environment, U.S. Treasury yield’s climb this year has been no secret. As the chart shows, however, the spike in government bond yield has been felt fairly uniformly across much of the developed world.
  • Rising rates’ impact on duration-sensitive assets this year has been acute. Large-cap growth stocks are down -21.5% year to date compared to -4.8% for large-cap value stocks.1 Meanwhile, domestic and global core fixed income, which investors traditionally rely on as a portfolio stabilizer, is down -9.8% and -12.3% as rising income hasn’t been able to offset deep price declines.1
  • Against a backdrop of sustained global inflation, rising government bond yields and falling fixed income prices, investors may be wise to seek alternative sources of income that have the potential to generate real income across varying rate and macro environments.

  • As of June 8, 2022. Returns based on the S&P 500 Growth Index and S&P Value Index. Domestic core fixed income represented by the Bloomberg U.S. Aggregate Index. Global refers to the Bloomberg Global Aggregate Index.

The chart of the week and any accompanying data is for informational purposes only and shall not be considered an investment recommendation or promotion of FS Investments or any FS Investments fund. The chart of the week is subject to change at any time based on market or other conditions, and FS Investments and FS Investment Solutions, LLC disclaim any responsibility to update such market commentary. The chart of the week should not be relied on as investment advice, and because investment decisions for the FS Investments funds are based on numerous factors, may not be relied on as an indication of the investment intent of any FS Investments fund. None of FS Investments, its funds, FS Investment Solutions, LLC or their respective affiliates can be held responsible for any direct or incidental loss incurred as a result of any reliance on the chart of the week or other opinions expressed therein. Any discussion of past performance should not be used as an indicator of future results.

This information is educational in nature and does not constitute a financial promotion, investment advice or an inducement or incitement to participate in any product, offering or investment. FS Investments is not adopting, making a recommendation for or endorsing any investment strategy or particular security. All views, opinions and positions expressed herein are that of the author and do not necessarily reflect the views, opinions or positions of FS Investments. All opinions are subject to change without notice, and you should always obtain current information and perform due diligence before participating in any investment. FS Investments does not provide legal or tax advice and the information herein should not be considered legal or tax advice. Tax laws and regulations are complex and subject to change, which can materially impact any investment result. FS Investments cannot guarantee that the information herein is accurate, complete, or timely. FS Investments makes no warranties with regard to such information or results obtained by its use, and disclaims any liability arising out of your use of, or any tax position taken in reliance on, such information.

Any projections, forecasts and estimates contained herein are based upon certain assumptions that the author considers reasonable. Projections are necessarily speculative in nature, and it can be expected that some or all of the assumptions underlying the projections will not materialize or will vary significantly from actual results. The inclusion of projections herein should not be regarded as a representation or guarantee regarding the reliability, accuracy or completeness of the information contained herein, and neither FS Investments nor the author are under any obligation to update or keep current such information.

All investing is subject to risk, including the possible loss of the money you invest.

Search our site