Chart of the week

Rent, labor markets continue to challenge Fed

As the Fed remains determined to temper inflation, this week’s chart looks at two stubborn inflation drivers: shelter and labor markets.

September 23, 2022 | 2 minute read

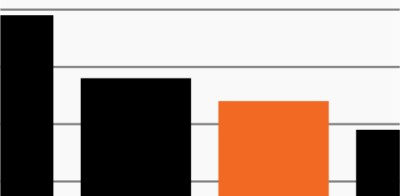
Rent and wage inflation

Source: Zillow Observed Rent Index, Bloomberg Finance, L.P., as of August 31, 2022. Wage growth represented by average hourly earnings.

  • Following their decidedly hawkish pivot at Jackson Hole, Fed policymakers took another major step this week, hiking rates by 75 basis points as expected and preparing markets for further significant hikes. In his post-statement press conference, Chair Powell emphasized that there would be more pain to come, noting the window for a soft landing has diminished.
  • He left little doubt about the Fed’s resolve, emphasizing that the labor market must soften while the housing market needs a “reset” as both areas have been the epicenter of core inflationary pressures over the past year.
  • The chart highlights the significant work the Fed still has ahead of it in both categories. As it shows, policymakers have clearly achieved some success in tempering rental costs (part of the larger shelter category), yet annual rent inflation of about 11% remains far above its pre-pandemic trend.1
  • While the Fed expects unemployment to climb to 4.4% next year, the labor market has yet to show any significant sign of cooling. Average hourly earnings growth (black line) has come in at 5% or higher all year while initial unemployment claims have remained stubbornly low.1
  • To be clear, the Fed could achieve its inflation goals while guiding the economy to a soft landing, but recent data highlights how tight the path there is. In the meantime, investors may be wise to remain focused on alternative investments that have historically offered the potential to protect capital and generate real returns within volatile markets. 

  • Zillow Observed Rent Index, Bloomberg Finance, L.P., as of August 31, 2022.

The chart of the week and any accompanying data is for informational purposes only and shall not be considered an investment recommendation or promotion of FS Investments or any FS Investments fund. The chart of the week is subject to change at any time based on market or other conditions, and FS Investments and FS Investment Solutions, LLC disclaim any responsibility to update such market commentary. The chart of the week should not be relied on as investment advice, and because investment decisions for the FS Investments funds are based on numerous factors, may not be relied on as an indication of the investment intent of any FS Investments fund. None of FS Investments, its funds, FS Investment Solutions, LLC or their respective affiliates can be held responsible for any direct or incidental loss incurred as a result of any reliance on the chart of the week or other opinions expressed therein. Any discussion of past performance should not be used as an indicator of future results.

This information is educational in nature and does not constitute a financial promotion, investment advice or an inducement or incitement to participate in any product, offering or investment. FS Investments is not adopting, making a recommendation for or endorsing any investment strategy or particular security. All views, opinions and positions expressed herein are that of the author and do not necessarily reflect the views, opinions or positions of FS Investments. All opinions are subject to change without notice, and you should always obtain current information and perform due diligence before participating in any investment. FS Investments does not provide legal or tax advice and the information herein should not be considered legal or tax advice. Tax laws and regulations are complex and subject to change, which can materially impact any investment result. FS Investments cannot guarantee that the information herein is accurate, complete, or timely. FS Investments makes no warranties with regard to such information or results obtained by its use, and disclaims any liability arising out of your use of, or any tax position taken in reliance on, such information.

Any projections, forecasts and estimates contained herein are based upon certain assumptions that the author considers reasonable. Projections are necessarily speculative in nature, and it can be expected that some or all of the assumptions underlying the projections will not materialize or will vary significantly from actual results. The inclusion of projections herein should not be regarded as a representation or guarantee regarding the reliability, accuracy or completeness of the information contained herein, and neither FS Investments nor the author are under any obligation to update or keep current such information.

All investing is subject to risk, including the possible loss of the money you invest.

Search our site