Chart of the week

Private CRE debt offers a hefty yield premium to cash

This week’s chart looks at private CRE debt’s notable yield premium to cash, even as cash yields are elevated.

December 15, 2023 | 2 minute read

Private CRE debt yield premium and annual realized credit losses

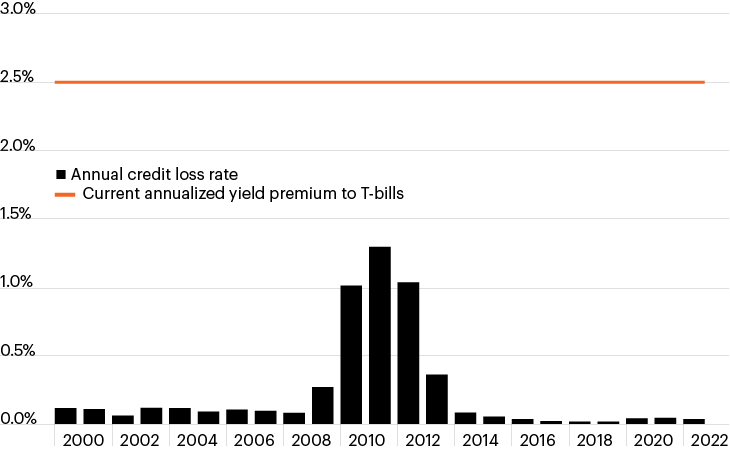
Source: Giliberto-Levy, NCREIF/CREFC, as of September 30, 2023

  • The commercial real estate (CRE) market continues to endure a correction that began 18 months ago as interest and mortgage rates surged.
  • These conditions have provided a challenging backdrop for property owners as prices have steadily declined. But conditions for lenders have rarely been better.
  • Private CRE debt yields of approximately 7.9% remain elevated while loans are generally being made on lender-friendly terms—for example, most loans today are originated with conservative loan-to-value ratios below 65%.1
  • Cash is a more attractive investment than it has been in recent years, but CRE debt continues to command a yield premium of about 250 bps over the 3-month Treasury bill, as the chart highlights.1 Even considering historical realized CRE loan loss rates, which peaked at 130 bps during the height of the global financial crisis, CRE debt’s yield premium remains notable.1
  • While 2024 could represent another year of uncertainty as the CRE market comes to terms with higher financing costs, lenders could find themselves in an increasingly attractive position as the composition of CRE returns evolves toward current yield and income growth, rather than price growth.

  • Giliberto-Levy, NCREIF/CREF, as of September 30, 2023, latest data available. 3-month U.S. Treasury Bill, as of
    November 30, 2023.

The chart of the week and any accompanying data is for informational purposes only and shall not be considered an investment recommendation or promotion of FS Investments or any FS Investments fund. The chart of the week is subject to change at any time based on market or other conditions, and FS Investments and FS Investment Solutions, LLC disclaim any responsibility to update such market commentary. The chart of the week should not be relied on as investment advice, and because investment decisions for the FS Investments funds are based on numerous factors, may not be relied on as an indication of the investment intent of any FS Investments fund. None of FS Investments, its funds, FS Investment Solutions, LLC or their respective affiliates can be held responsible for any direct or incidental loss incurred as a result of any reliance on the chart of the week or other opinions expressed therein. Any discussion of past performance should not be used as an indicator of future results.

This information is educational in nature and does not constitute a financial promotion, investment advice or an inducement or incitement to participate in any product, offering or investment. FS Investments is not adopting, making a recommendation for or endorsing any investment strategy or particular security. All views, opinions and positions expressed herein are that of the author and do not necessarily reflect the views, opinions or positions of FS Investments. All opinions are subject to change without notice, and you should always obtain current information and perform due diligence before participating in any investment. FS Investments does not provide legal or tax advice and the information herein should not be considered legal or tax advice. Tax laws and regulations are complex and subject to change, which can materially impact any investment result. FS Investments cannot guarantee that the information herein is accurate, complete, or timely. FS Investments makes no warranties with regard to such information or results obtained by its use, and disclaims any liability arising out of your use of, or any tax position taken in reliance on, such information.

Any projections, forecasts and estimates contained herein are based upon certain assumptions that the author considers reasonable. Projections are necessarily speculative in nature, and it can be expected that some or all of the assumptions underlying the projections will not materialize or will vary significantly from actual results. The inclusion of projections herein should not be regarded as a representation or guarantee regarding the reliability, accuracy or completeness of the information contained herein, and neither FS Investments nor the author are under any obligation to update or keep current such information.

All investing is subject to risk, including the possible loss of the money you invest.

Search our site