Chart of the week

Private credit maintains its healthy yield premium

Amid private debt’s massive growth, this week’s chart looks at the healthy yield premium of private credit transactions compared to public markets.

March 22, 2024 | 3 minute read

Yields on private and public debt investments

Line chart shows private credit investments’ yield premium of about 300 basis points over that of the broadly syndicated leverage loan market.

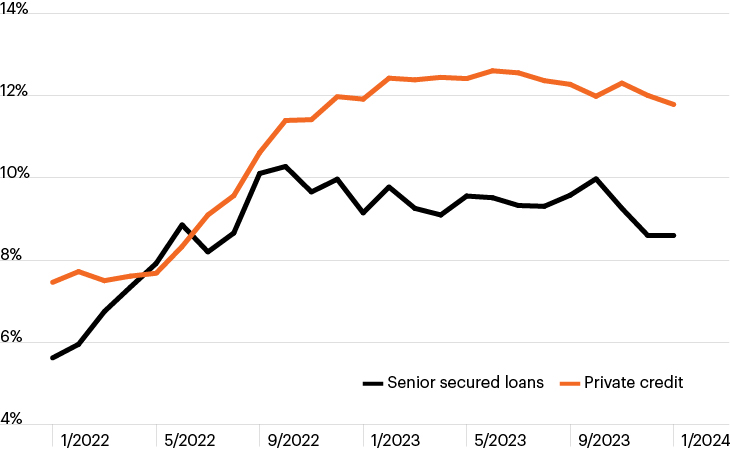
Source: J.P. Morgan as of January 2024. Private credit yields based on a composite of J.P. Morgan private credit transactions’ yield to maturity at transaction close. Senior secured loans based on J.P. Morgan Loan Index. 

  • Once a niche asset class, the private debt market has grown to $1.6 trillion in assets and is a critical source of financing for corporate borrowers. As banks pulled back from non-core lending activities and narrowed their focus to core sectors and clients, private, non-bank lenders have stepped in to fill the void.1
  • Private lenders’ growth has helped broaden the capital sources available to small- and medium-sized borrowers. In addition, private lenders typically provide more customized financing solutions for corporate borrowers compared to the syndicated loan market.
  • For investors, adding private debt to a portfolio of traditional stocks and bonds may help deliver a high level of income and diversification potential.
  • Even amid the elevated rate environment of the past year, an index of private credit investments maintained a yield premium of about 300 basis points over that of the broadly syndicated leveraged loan market, as the chart highlights.2
  • At a time when equity valuations are elevated, the rate outlook remains volatile and the correlation between stocks and bonds is high, private debt may provide an attractive opportunity for investors seeking above-market yields and the potential for portfolio diversification.

  • Preqin as of Q4 2023.

  • J.P. Morgan as of January 2024. Private credit yields based on a composite of J.P. Morgan private credit transactions’ yield to maturity at transaction close. Senior secured loans based on J.P. Morgan Loan Index.

The chart of the week and any accompanying data is for informational purposes only and shall not be considered an investment recommendation or promotion of FS Investments or any FS Investments fund. The chart of the week is subject to change at any time based on market or other conditions, and FS Investments and FS Investment Solutions, LLC disclaim any responsibility to update such market commentary. The chart of the week should not be relied on as investment advice, and because investment decisions for the FS Investments funds are based on numerous factors, may not be relied on as an indication of the investment intent of any FS Investments fund. None of FS Investments, its funds, FS Investment Solutions, LLC or their respective affiliates can be held responsible for any direct or incidental loss incurred as a result of any reliance on the chart of the week or other opinions expressed therein. Any discussion of past performance should not be used as an indicator of future results.

This information is educational in nature and does not constitute a financial promotion, investment advice or an inducement or incitement to participate in any product, offering or investment. FS Investments is not adopting, making a recommendation for or endorsing any investment strategy or particular security. All views, opinions and positions expressed herein are that of the author and do not necessarily reflect the views, opinions or positions of FS Investments. All opinions are subject to change without notice, and you should always obtain current information and perform due diligence before participating in any investment. FS Investments does not provide legal or tax advice and the information herein should not be considered legal or tax advice. Tax laws and regulations are complex and subject to change, which can materially impact any investment result. FS Investments cannot guarantee that the information herein is accurate, complete, or timely. FS Investments makes no warranties with regard to such information or results obtained by its use, and disclaims any liability arising out of your use of, or any tax position taken in reliance on, such information.

Any projections, forecasts and estimates contained herein are based upon certain assumptions that the author considers reasonable. Projections are necessarily speculative in nature, and it can be expected that some or all of the assumptions underlying the projections will not materialize or will vary significantly from actual results. The inclusion of projections herein should not be regarded as a representation or guarantee regarding the reliability, accuracy or completeness of the information contained herein, and neither FS Investments nor the author are under any obligation to update or keep current such information.

All investing is subject to risk, including the possible loss of the money you invest.

Search our site