Chart of the week

With investor sentiment stretched, time to diversify?

This week’s chart looks at the spread between bullish and bearish investors, which has widened significantly in the past several months.

March 8, 2024 | 3 minute read

AAII Investor Sentiment bull-bear spread

Line chart showing the spread between bullish and bearish investors is stretched near its high of the past five years.

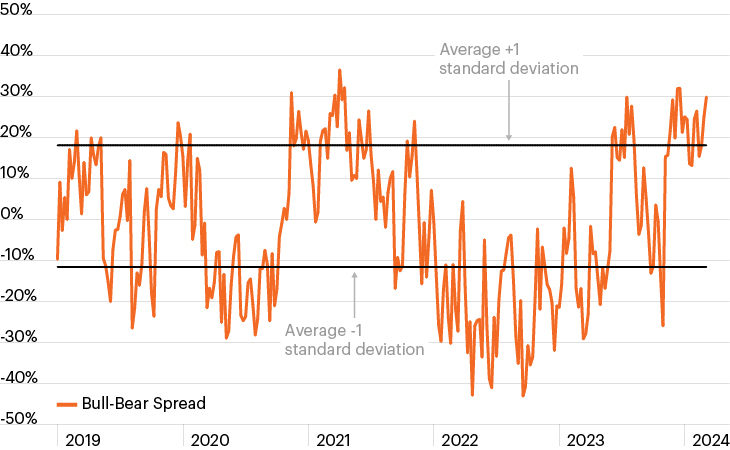
Source: American Association of Individual Investors, as of March 6, 2024

  • Investor sentiment moved sharply higher late last year and has remained elevated as equities continued their Q4 2023 rally into the first quarter of 2024. The market rally continues to be driven primarily by exceptional tech outperformance while markets have shrugged off rising Treasury yields as the result of an economic acceleration.
  • As the chart highlights, the spread between bullish and bearish investors today looks stretched, sitting far above its average (6.6%) since the inception of the survey in March 1987.1
  • Yet with equity multiples near historically expensive territory and markets faced with the prospect of adjusting to less aggressive (or no) rate cuts this year, it’s fair to wonder whether investors continue to price equities for a perfect, Goldilocks scenario.
  • Indeed, even if the U.S. achieves the soft-landing scenario that many investors believe it will, forward-looking indicators continue to point toward the potential for slowing growth, continued rate volatility and ongoing geopolitical uncertainty.
  • Against this backdrop, today’s environment in which U.S. stocks sit at an all-time high while macro uncertainty looms perhaps larger than normal may represent an opportune time for investors to trim their exposure to traditional stocks in search of less correlated sources of growth and diversification.

  • American Association of Individual Investors, as of March 6, 2024

The chart of the week and any accompanying data is for informational purposes only and shall not be considered an investment recommendation or promotion of FS Investments or any FS Investments fund. The chart of the week is subject to change at any time based on market or other conditions, and FS Investments and FS Investment Solutions, LLC disclaim any responsibility to update such market commentary. The chart of the week should not be relied on as investment advice, and because investment decisions for the FS Investments funds are based on numerous factors, may not be relied on as an indication of the investment intent of any FS Investments fund. None of FS Investments, its funds, FS Investment Solutions, LLC or their respective affiliates can be held responsible for any direct or incidental loss incurred as a result of any reliance on the chart of the week or other opinions expressed therein. Any discussion of past performance should not be used as an indicator of future results.

This information is educational in nature and does not constitute a financial promotion, investment advice or an inducement or incitement to participate in any product, offering or investment. FS Investments is not adopting, making a recommendation for or endorsing any investment strategy or particular security. All views, opinions and positions expressed herein are that of the author and do not necessarily reflect the views, opinions or positions of FS Investments. All opinions are subject to change without notice, and you should always obtain current information and perform due diligence before participating in any investment. FS Investments does not provide legal or tax advice and the information herein should not be considered legal or tax advice. Tax laws and regulations are complex and subject to change, which can materially impact any investment result. FS Investments cannot guarantee that the information herein is accurate, complete, or timely. FS Investments makes no warranties with regard to such information or results obtained by its use, and disclaims any liability arising out of your use of, or any tax position taken in reliance on, such information.

Any projections, forecasts and estimates contained herein are based upon certain assumptions that the author considers reasonable. Projections are necessarily speculative in nature, and it can be expected that some or all of the assumptions underlying the projections will not materialize or will vary significantly from actual results. The inclusion of projections herein should not be regarded as a representation or guarantee regarding the reliability, accuracy or completeness of the information contained herein, and neither FS Investments nor the author are under any obligation to update or keep current such information.

All investing is subject to risk, including the possible loss of the money you invest.

Search our site