Chart of the week

Middle market companies tripled growth of large cap peers

Middle market private equity sponsors have historically provided outsized value compared to their large cap peers.

April 12, 2024 | 2 minute read

Weighted average changes from sponsor entry to exit

Column chart showing middle market private equity investments driving 2.9x the revenue and 2.7x the EBITDA growth over large cap companies.

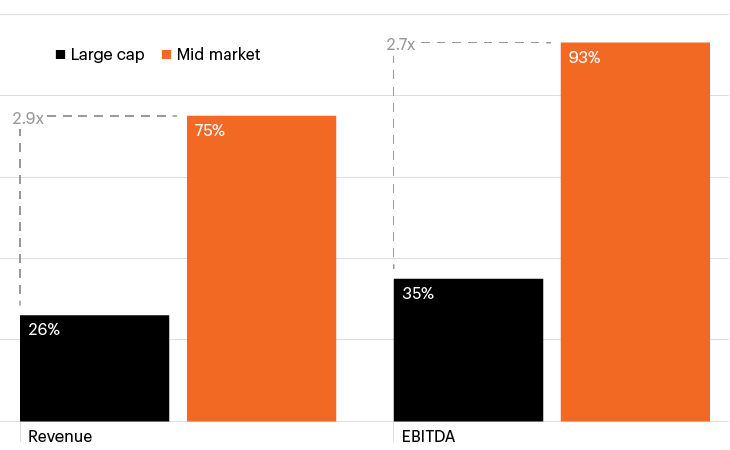
Source: Morgan Stanley Investment Management as of June 30, 2023. Data represents a sample of 166 total transactions including only U.S. deals, excluding Morgan Stanley transactions—37 large cap and 129 middle market—that report on enterprise value, revenue, EBITDA, net debt, public/private company. Middle market is defined as a transaction value of $500M or less.

  • The private U.S. middle market, comprised of 200,000 business with revenues between $10 million and $1 billion, has served as a driving force of the domestic economy for decades representing one-third of private sector gross domestic product (GDP) and employing approximately 48 million people.1
  • Given the smaller size of middle market companies and highly fragmented nature of the middle market, middle market private equity managers often have greater options at their disposal to grow revenues and margins than their large cap peers through a combination of customer acquisition, new product launches and market expansion, as well as operational improvements. 
  • As the chart shows, middle market managers have increased revenues and EBITDA by 75% and 93%, respectively, from the time of purchasing a business to the time of their exit, nearly tripling the growth generated by large cap peers.2
  • Fundamental changes in financial markets and the global economy in recent years have created many challenges for investors looking for reliable sources of growth and diversification. Amid a more muted outlook for public equities, the private U.S. middle market may serve as a diversified source of growth within investors’ portfolios.

  • National Center for the Middle Market Middle Market Indicator, Year End 2023.

  • Morgan Stanley Investment Management based on a database of transaction level information, including only U.S. deals, excluding MS transactions.

The chart of the week and any accompanying data is for informational purposes only and shall not be considered an investment recommendation or promotion of FS Investments or any FS Investments fund. The chart of the week is subject to change at any time based on market or other conditions, and FS Investments and FS Investment Solutions, LLC disclaim any responsibility to update such market commentary. The chart of the week should not be relied on as investment advice, and because investment decisions for the FS Investments funds are based on numerous factors, may not be relied on as an indication of the investment intent of any FS Investments fund. None of FS Investments, its funds, FS Investment Solutions, LLC or their respective affiliates can be held responsible for any direct or incidental loss incurred as a result of any reliance on the chart of the week or other opinions expressed therein. Any discussion of past performance should not be used as an indicator of future results.

This information is educational in nature and does not constitute a financial promotion, investment advice or an inducement or incitement to participate in any product, offering or investment. FS Investments is not adopting, making a recommendation for or endorsing any investment strategy or particular security. All views, opinions and positions expressed herein are that of the author and do not necessarily reflect the views, opinions or positions of FS Investments. All opinions are subject to change without notice, and you should always obtain current information and perform due diligence before participating in any investment. FS Investments does not provide legal or tax advice and the information herein should not be considered legal or tax advice. Tax laws and regulations are complex and subject to change, which can materially impact any investment result. FS Investments cannot guarantee that the information herein is accurate, complete, or timely. FS Investments makes no warranties with regard to such information or results obtained by its use, and disclaims any liability arising out of your use of, or any tax position taken in reliance on, such information.

Any projections, forecasts and estimates contained herein are based upon certain assumptions that the author considers reasonable. Projections are necessarily speculative in nature, and it can be expected that some or all of the assumptions underlying the projections will not materialize or will vary significantly from actual results. The inclusion of projections herein should not be regarded as a representation or guarantee regarding the reliability, accuracy or completeness of the information contained herein, and neither FS Investments nor the author are under any obligation to update or keep current such information.

All investing is subject to risk, including the possible loss of the money you invest.

Search our site